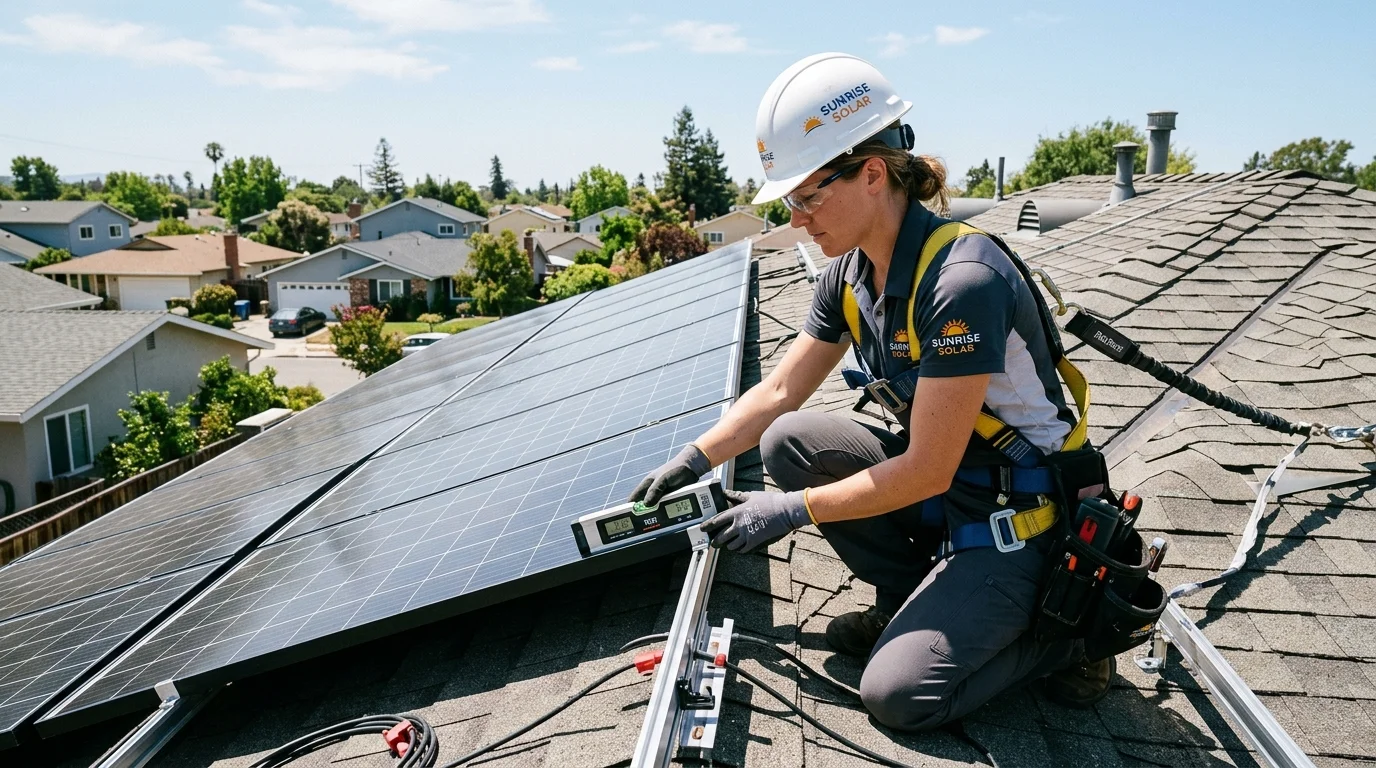
Determining how many solar panels your home needs is the first technical question every prospective solar homeowner faces. An undersized system leaves you paying substantial utility grid bills, while an oversized system incurs unnecessary upfront capital expense and risks export-curtailment depending on local utility net-metering regulations.
Rather than relying on installer rules of thumb or rough guesses, you can size your system accurately using transparent photovoltaic engineering principles based on your actual energy consumption (kWh), regional solar irradiance, comprehensive system losses, and usable shadow-free roof space.
Why Sizing by "Monthly Bill Amount" Is Misleading
A common mistake among homeowners is asking an installer: "My monthly electricity bill is ₹3,500 ($100)—how many panels do I need?"
Sizing a photovoltaic system based purely on the currency amount of your monthly bill is fundamentally inaccurate for several reasons:
- Non-Energy Bill Components: Electricity bills include fixed charges, sanctioned load capacity fees, municipal taxes, fuel cost adjustments (FCA/FPPPA), and meter rents. These charges do not scale linearly with kWh consumption and are not fully eliminated by solar generation.
- Progressive Slab Tariffs: Most electric utilities apply telescopic or tiered tariffs where higher units cost significantly more per kWh. A summer bill spike due to air conditioning pushes consumption into the most expensive tariff slab, artificially inflating the monetary bill compared to cooler months.
- Seasonal Fluctuations: Sizing based on an extreme summer or winter bill results in an improperly sized array for the remaining 9 to 10 months of the year.
Best Practice: Always size your system using actual billed units (kWh) compiled across 12 consecutive months of utility statements. This ensures your calculation accounts for seasonal usage peaks and troughs.
Core Factors That Determine Solar System Sizing
Accurate solar array sizing requires evaluating four core engineering variables:
1. Location & Peak Sun Hours (PSH)
A Peak Sun Hour (PSH) represents the equivalent number of hours per day when solar irradiance averages 1,000 watts per square meter (1 kW/m²). It is not equivalent to total daylight hours.
- Most regions in India, Australia, Southern Europe, and the US Sun Belt receive an annual average of 4.2 to 5.5 Peak Sun Hours per day.
- High-latitude regions or areas with prolonged monsoons or winter cloud cover may drop to 3.2 to 4.0 PSH.
2. Comprehensive System Losses (Performance Ratio / PR)
No rooftop solar installation operates at 100% theoretical efficiency under field conditions. A realistic calculation must incorporate standard balance-of-system (BOS) losses as site-dependent variables rather than universal constants:
- Thermal Derating: Solar panel nameplate wattage is rated at Standard Test Conditions (STC: 25°C cell temperature). Thermal loss is not a static universal value; under warm summer operating conditions where cell temperatures reach 50°C to 65°C, thermal derating can illustratively reduce power output by 8% to 14% depending on the module's specific temperature coefficient (typically ~ -0.30% to -0.38% per °C for maximum power output, Pmp) and ambient airflow.
- Inverter Conversion Loss: High-quality string inverters and microinverters operate at 96% to 98% weighted efficiency, introducing an expected 2% to 4% conversion loss.
- Dust, Soiling & Environmental Deposition: Dust and particulate accumulation on panel glass typically accounts for an estimated 3% to 6% loss between cleanings, though actual losses vary significantly with local air quality, rainfall frequency, and cleaning intervals.
- DC & AC Wiring Losses: Cable resistance and ohmic losses contribute an estimated 1.5% to 2.5%.
(Note: Module degradation—including ~1% to 2% first-year light-induced degradation / LID and long-term annual wear of ~0.4% to 0.55%/year—is evaluated over the 25-year lifecycle rather than routine daily operational losses).
Together, routine BOS and thermal losses result in an illustrative system Performance Ratio (PR) of 0.75 to 0.80 (75% to 80%). A standard conservative planning assumption used by solar engineers is 0.78 (78%). Both Peak Sun Hours (PSH) and the 0.78 PR are illustrative planning assumptions used to model realistic output. You can also evaluate your own home's consumption using our interactive Rooftop Solar Savings Estimator to calculate estimated capacity, panel count, and annual generation.
3. Roof Orientation, Tilt & Usable Shadow-Free Space
- Orientation: In the Northern Hemisphere (India, Europe, North America), facing panels True South is the general rule of thumb to maximize total annual energy capture. However, the exact optimum orientation can vary with local latitude, roof architecture, and household consumption patterns (for example, West-facing arrays generate more during late afternoon peak tariff periods).
- Tilt Angle: Panels are typically mounted at a tilt roughly equal to the site's latitude (often 15° to 25° in central and northern India) to optimize annual yield and ensure natural rainwater runoff for self-cleaning.
- Shading Restrictions: Obstructions like parapet walls, overhead water tanks, elevator headrooms, chimney vents, and neighboring trees cast shadows that reduce solar production. The exact severity of shading losses depends on module bypass diode design, string layout, inverter MPPT tracking, and whether module-level power electronics (MLPE, such as DC optimizers or microinverters) are used. On traditional single-MPPT series strings, partial shadow on one section can noticeably curtail string current, whereas modern half-cut cell modules and multi-MPPT inverters significantly mitigate localized losses.
4. Usable Roof Area vs. Walkways: A Planning Estimate
The physical footprint of solar panels is only one part of the required roof space. Installers must account for row-to-row spacing (to prevent front rows from casting shadows on rear rows at low winter sun angles), structural anchoring, parapet wall setbacks, and 2 to 3-foot perimeter service walkways for cleaning and maintenance.
The 80 to 100 square feet (7.5 to 9.5 m²) per 1 kW benchmark is a preliminary planning estimate, not a universal requirement. The actual required area varies with module efficiency, roof geometry, row spacing to prevent winter shading, parapet setbacks, and existing rooftop obstacles (such as water tanks, vents, and AC compressors).
The 4-Step Sizing Calculation
To determine your home's required solar capacity, work through the following sequential calculation:
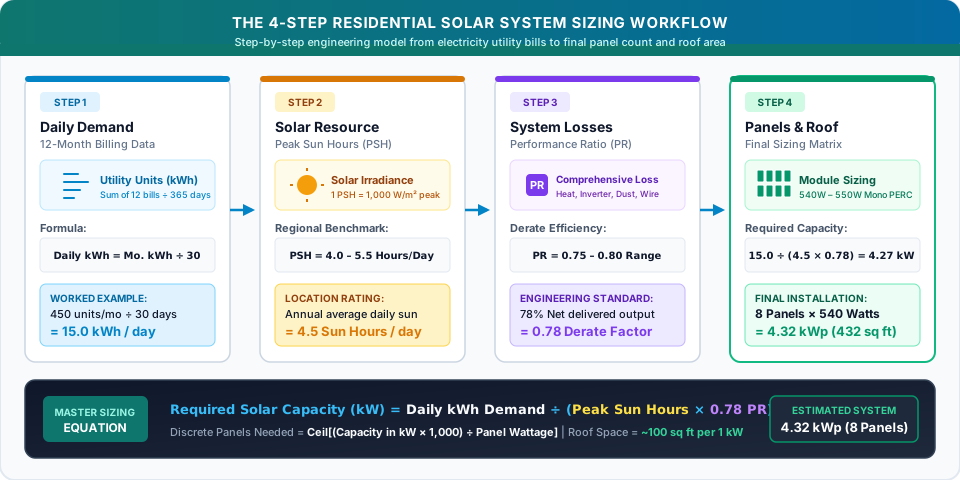
Formula:
Detailed Worked Examples: 3 kW and 5 kW Systems
To see how these formulas apply in practice, examine two transparent residential engineering examples with all assumptions declared.
Important Sizing Disclaimer: The calculations below represent annualized engineering sizing estimates for planning purposes, not guaranteed daily generation. Actual daily generation fluctuates substantially across seasons—typically peaking during clear spring/pre-summer months and dipping significantly during heavy monsoon cloud cover or winter fog.
Example A: Sizing a 3 kW System (Small to Medium Household)
This example represents a typical 2 to 3-bedroom urban home with lighting, fans, a refrigerator, washing machine, television, and one energy-efficient inverter air conditioner.
Baseline Assumptions:
- Annual Electricity Consumption: 3,960 kWh/year (averaging 330 kWh/month).
- Average Daily Consumption: 3,960 ÷ 365 = 10.85 kWh/day.
- Location Solar Resource: 4.8 Peak Sun Hours (PSH) per day (illustrative estimate for central/western India).
- System Performance Ratio (PR): 0.78 (22% combined illustrative BOS and thermal losses).
- Selected Panel Rating: 540W Monocrystalline TOPCon half-cut panels (2.28 m × 1.13 m footprint per panel).
Calculation:
- Required DC Capacity:Capacity (kW) = 10.85 kWh ÷ (4.8 PSH × 0.78) = 10.85 ÷ 3.744 ≈ 2.90 kW
- Panel Count:Number of Panels = 2,900 W ÷ 540 W = 5.37 → 6 panels
- Actual Installed DC Rating: 6 × 540 W = 3.24 kWp.
- Expected Annualized Daily Generation:3.24 kWp × 4.8 PSH × 0.78 ≈ 12.13 kWh/day (~4,420 kWh/year)
- Estimated Roof Space Needed: 6 panels × 28 sq. ft./panel ≈ 168 sq. ft. of raw module area. Adding necessary inter-row pitch and a 2.5-foot cleaning walkway brings the estimated shadow-free roof footprint to 260 to 300 square feet (24 to 28 m²).
- Required DC Capacity:
Example B: Sizing a 5 kW System (Medium to Large Household)
This example represents a larger household with multiple air conditioners, a water heater/geyser, a microwave, home office equipment, and intermittent EV charging.
Baseline Assumptions:
- Annual Electricity Consumption: 6,600 kWh/year (averaging 550 kWh/month).
- Average Daily Consumption: 6,600 ÷ 365 = 18.08 kWh/day.
- Location Solar Resource: 4.6 Peak Sun Hours (PSH) per day (accounting for regional cloud patterns).
- System Performance Ratio (PR): 0.78 (22% total illustrative system losses).
- Selected Panel Rating: 540W Monocrystalline half-cut modules.
Calculation:
- Required DC Capacity:Capacity (kW) = 18.08 kWh ÷ (4.6 PSH × 0.78) = 18.08 ÷ 3.588 ≈ 5.04 kW
- Panel Count:Number of Panels = 5,040 W ÷ 540 W = 9.33 → 10 panels
- Actual Installed DC Rating: 10 × 540 W = 5.40 kWp.
- Expected Annualized Daily Generation:5.40 kWp × 4.6 PSH × 0.78 ≈ 19.37 kWh/day (~7,070 kWh/year)
- Estimated Roof Space Needed: 10 panels × 28 sq. ft./panel ≈ 280 sq. ft. of raw module area. Including row spacing and perimeter service walkways results in a planning estimate of 450 to 520 square feet (42 to 48 m²) of clear, unshaded roof surface.
- Required DC Capacity:
Solar Sizing Ready-Reckoner Table
Use this reference table to estimate system requirements based on your household's actual annual electricity units:
| Monthly Consumption (kWh) | Recommended Capacity | Annual Output (approx.) | Approx. Panel Count (540W modules)* | Estimated Clear Roof Footprint |
|---|---|---|---|---|
| 150 – 200 kWh | 1.5 kW – 2.0 kW | 2,100 – 2,800 kWh | 3 to 4 panels (1.62 – 2.16 kWp) | 140 – 190 sq. ft. (13 – 18 m²) |
| 300 – 350 kWh | 3.0 kW – 3.3 kW | 4,200 – 4,600 kWh | 6 panels (3.24 kWp) | 260 – 310 sq. ft. (24 – 29 m²) |
| 450 – 550 kWh | 4.5 kW – 5.5 kW | 6,300 – 7,500 kWh | 9 to 11 panels (4.86 – 5.94 kWp) | 420 – 520 sq. ft. (39 – 48 m²) |
| 700 – 800 kWh | 6.5 kW – 7.5 kW | 9,100 – 10,500 kWh | 12 to 14 panels (6.48 – 7.56 kWp) | 600 – 720 sq. ft. (56 – 67 m²) |
| 1,000+ kWh | 9.0 kW – 10.0 kW (indicative) | 12,600 – 14,000 kWh | 17 to 19 panels (9.18 – 10.26 kWp) | 850 – 1,000 sq. ft. (79 – 93 m²) |
Note: Panel counts and ratings are approximate based on standard 540W modules. For high-consumption properties consuming 1,000+ kWh/month, 9–10 kW (17–19 panels) represents only a coarse baseline estimate. At this capacity tier, homeowners must conduct an actual location-based engineering simulation, verify three-phase supply requirements with their local utility, and assess statutory rooftop structural loading limits rather than relying on rough estimates.
System Capital Cost vs. Government Subsidies: Keeping Them Distinct
When evaluating solar economics, prospective buyers must keep Gross Turnkey Capital Cost (CAPEX) and Government Financial Assistance (Subsidy) strictly separated. Marketing figures frequently advertise "effective" net costs that assume automatic maximum subsidies, ignoring technical qualification criteria, DISCOM approvals, and disbursement timelines.
How the PM Surya Ghar Subsidy Framework Shapes Sizing Economics
In India, residential rooftop solar financial viability is anchored by central capital assistance under the PM Surya Ghar: Muft Bijli Yojana. Rather than offering an unrestricted percentage discount, the central government utilizes a two-tiered stepped capacity model capped at 3 kW. Understanding this structure prevents homeowners from over-sizing or expecting proportional assistance on higher capacities:
- The Primary Tier (First 2 kW): The scheme provides maximum financial assistance of ₹30,000 per kW for the first two kilowatts of capacity (delivering ₹30,000 for a 1 kW plant and ₹60,000 for a 2 kW plant). This tier offers the fastest capital payback period for low-to-moderate consumption households.
- The Secondary Tier (The 3rd kW): For systems expanding between 2 kW and 3 kW, central support provides ₹18,000 for the incremental kilowatt, bringing the cumulative subsidy for a 3 kW installation to exactly ₹78,000.
- The 3 kW Household Ceiling: Installations above 3 kW (such as 4 kW, 5 kW, or 10 kW) do not receive additional central funds; the individual residential subsidy is permanently capped at ₹78,000. While homeowners with heavy consumption (e.g., multiple ACs or electric vehicles) routinely install 4 kW to 6 kW arrays to offset higher tier utility tariffs, any capacity beyond 3 kW is 100% self-funded.
- Group Housing Societies & Residential Welfare Associations (GHS/RWA): To incentivize shared community power, housing societies can claim ₹18,000 per kW for common area loads—such as water pumping, corridor illumination, and shared EV chargers—up to an aggregate limit of 500 kW (calculated at 3 kW per individual apartment).
- Special Category Regional Incentives: Residential properties in special-category states and union territories (including Uttarakhand, Himachal Pradesh, Jammu & Kashmir, Ladakh, the North-Eastern states, and island territories) qualify for an additional 10% central subsidy per kW above the baseline rates.
Aligning Monthly Billing with Recommended System Tiers:
The national portal pairs household consumption brackets with recommended capacity benchmarks to guide right-sizing:
- 0 to 150 Units / Month: Typically requires a compact 1 kW to 2 kW system (yielding ₹30,000 to ₹60,000 in central support) to eliminate routine daytime baseloads.
- 150 to 300 Units / Month: The optimal threshold for a 2 kW to 3 kW system (attracting ₹60,000 to ₹78,000 in central assistance), neutralizing bills for standard 2–3 bedroom homes.
- Above 300 Units / Month: Requires 3 kW or higher capacity. Sizing beyond 3 kW must be evaluated based on gross return on investment and DISCOM net-metering settlement rules, as central assistance remains fixed at the ₹78,000 ceiling.
Statutory Compliance & Portal Verification: All central subsidy disbursements operate strictly via Direct Benefit Transfer (DBT) into the applicant’s verified bank account. Eligibility requires using certified Domestic Content Requirement (DCR) solar modules listed on MNRE's Approved Models and Manufacturers List (ALMM) and completing installation through an empaneled vendor registered on the national portal (
pmsuryaghar.gov.in).
Transparent Cost & Subsidy Overview: Understanding Your Real Investment
When purchasing a rooftop solar system, homeowners are frequently confused by advertisements claiming "Get a 3 kW solar system for just ₹85,000!" In reality, solar transactions involve an upfront capital layout followed by a government reimbursement. To budget accurately and avoid unexpected cash shortfalls, you must understand the three distinct figures in the breakdown below:
| System Size | Indicative Gross Turnkey Cost (CAPEX)* | Central Subsidy (PM Surya Ghar) | Indicative Net Out-of-Pocket Expense |
|---|---|---|---|
| 1 kW | ₹55,000 – ₹70,000 | ₹30,000 | ₹25,000 – ₹40,000 |
| 2 kW | ₹1,15,000 – ₹1,35,000 | ₹60,000 | ₹55,000 – ₹75,000 |
| 3 kW | ₹1,65,000 – ₹2,05,000 | ₹78,000 | ₹87,000 – ₹1,27,000 |
| 5 kW | ₹2,75,000 – ₹3,25,000 | ₹78,000 (capped ceiling) | ₹1,97,000 – ₹2,47,000 |
*Note: Turnkey CAPEX figures (₹55,000 to ₹3.25 Lakhs) are broad indicative market estimates for typical standard low-mount residential installations in India (baseline 2026). They are not guaranteed quotations. Actual vendor quotes vary based on structure height (e.g., elevated superstructures add ₹10,000 to ₹25,000 per kW), cabling distance, inverter brand, and local DISCOM interconnection fees. Always obtain site-specific quotations from empaneled local installers.
How to Interpret These Economics for Your Home:
- Cash Flow & Collateral-Free Financing: You do not need to pay the entire gross CAPEX out of savings. Under the PM Surya Ghar initiative, designated public and private sector banks (such as SBI, Canara Bank, and PNB) offer collateral-free rooftop solar loans at concessional interest rates (~7% p.a.) with down payments as low as 10%. In most homes, the monthly electricity bill savings comfortably exceed the monthly loan EMI, resulting in positive cash flow from month one.
- Payback Timelines & Long-Term Returns:
- For a 3 kW system (net out-of-pocket outlay: ~₹87,000 to ₹1,27,000), annual generation of ~4,420 units eliminates approximately ₹33,000 to ₹36,000 in grid electricity bills each year (at standard residential tariff rates of ₹7.50 to ₹8.50/kWh). This yields a complete capital payback in 2.5 to 3.5 years.
- For a 5 kW system (net out-of-pocket outlay: ~₹1,97,000 to ₹2,47,000), annual generation of ~7,070 units eliminates roughly ₹52,000 to ₹60,000 annually, achieving full capital recovery within 3.5 to 4.2 years.
- Because modern Tier-1 monocrystalline panels carry 25 to 30-year linear performance warranties, your household enjoys over 20 years of essentially free electricity after recouping your initial investment.
Key Subsidy Conditions & Verification Steps:
- Grid-Connected Requirement: Central assistance applies only to eligible grid-connected residential rooftop systems meeting the scheme's current technical and DISCOM requirements. Do not assume that hybrid systems or battery storage automatically qualify for assistance; always verify applicable inverter specifications and DISCOM rules directly on the official portal before purchasing. Standalone off-grid systems are ineligible under this scheme.
- DCR Mandate: Panels must use Domestic Content Requirement (DCR) certified solar cells and modules manufactured in India.
- Approved Channel: Installations must be completed through registered vendors empanelled on the National Rooftop Solar Portal (
pmsuryaghar.gov.in) and approved following technical feasibility and meter inspection by the local electricity distribution company (DISCOM).- Disbursement: The homeowner initially pays the turnkey cost to the vendor or through financed loans; the subsidy is disbursed directly to the consumer's bank account following commissioning and meter integration.
Authoritative Technical References & Calculation Tools
For further technical planning, regional solar irradiance modeling, and statutory subsidy guidelines, consult the following official resources:
- PM Surya Ghar Official Portal — National portal for residential rooftop solar registration, empanelled vendor lists, technical specifications, and central financial assistance guidelines.
- Guidelo Rooftop Solar Savings Estimator — Our interactive residential solar sizing calculator to compute system capacity, monthly generation, and financial payback based on actual household consumption.
- Ministry of New and Renewable Energy (MNRE) — Government of India policies, Approved Models and Manufacturers List (ALMM), and national renewable energy deployment frameworks.
- Central Electricity Authority (CEA) Connectivity Regulations — Statutory technical standards for connectivity of distributed solar generation resources to the distribution grid.
- International Renewable Energy Agency (IRENA) — Comprehensive global reports on renewable technology costs, balance-of-system benchmarks, and photovoltaic efficiency trends.