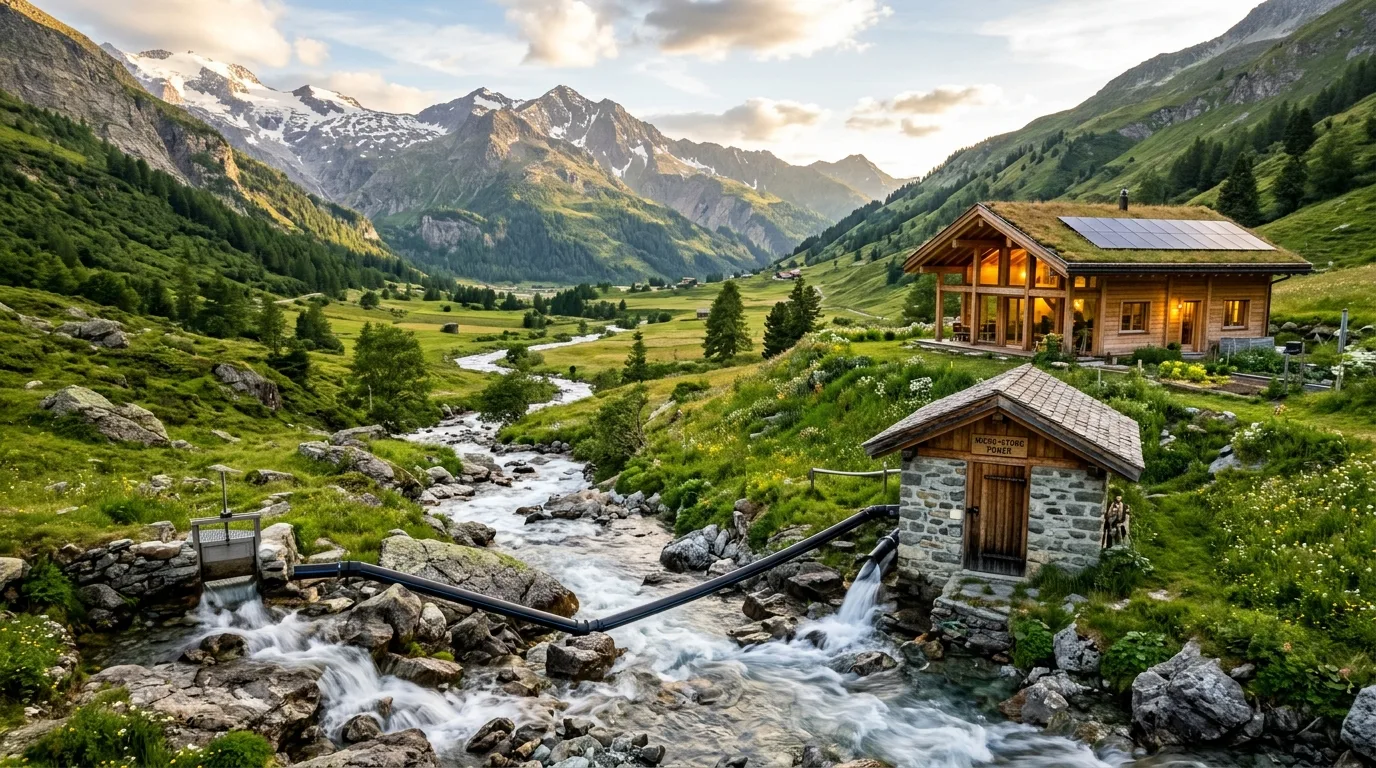
Hydropower is the oldest and historically most reliable source of renewable electricity in human civilization. While massive hydroelectric dams dominate national utility grids, this guide focuses on micro-hydropower systems generating up to 100 kilowatts (kW)—a practical threshold widely used in engineering literature and technical guides (such as the U.S. Department of Energy (DOE)) to designate decentralized systems suited for individual homesteads, mountain communities, and small agricultural operations. (Note: Statutory legal definitions vary by country; for instance, India's Ministry of New and Renewable Energy (MNRE) oversees all projects up to 25 MW under its broad Small Hydro Power Programme rather than maintaining a separate formal 100 kW statutory micro-hydro category).
Unlike solar panels (which produce power only during daylight hours) or wind turbines (which depend on unpredictable gusts), a micro-hydro system has the unique mechanical potential to generate continuous, 24/7 baseload electricity. However, real-world continuous delivery depends directly on reliable year-round streamflow, appropriate hydraulic sizing, and operational uptime.
This guide explains the physical principles of micro-hydro, the mathematical formulas governing turbine output, seasonal stream hydrology, turbine selection, environmental and legal constraints, and capital cost benchmarks.
1. The Physics of Hydro Energy: Head, Flow, and Turbine Output
To generate hydroelectric power, a flowing water resource must possess two fundamental physical characteristics:
- Head (Vertical Drop): The vertical distance that water falls from the intake water surface to the turbine runner, measured in meters or feet. Head creates hydrostatic pressure.
- Flow Rate (Volume): The volume of water passing through the system per unit of time, measured in liters per second (L/s), cubic meters per second (m³/s), or gallons per minute (GPM).
Gross Head vs. Net Head
A critical engineering distinction must be made between Gross Head and Net Head:
Gross Head ($H_{gross}$): The total static vertical elevation difference between the water intake level and the turbine discharge/nozzle.
Net Head ($H_{net}$): The actual usable pressure available at the turbine nozzle after subtracting hydraulic friction losses:
$$H_{net} = H_{gross} - H_{friction}$$
Friction against penstock pipe walls, directional bends, intake transitions, and shutoff valves causes dynamic pressure drops. In a well-engineered system, penstock piping is sized so that total friction losses consume no more than 10% to 20% of gross head.
The Hydropower Power Equation
The electrical power potential of any flowing water source is calculated using the standard hydrodynamic equation:
Where:
- Head ($H_{net}$ in meters): Usable vertical drop after deducting pipe friction losses.
- Flow ($Q$ in L/s): Usable diverted water volume directed through the penstock.
- 9.81: Product of earth's gravitational acceleration ($g = 9.81\text{ m/s}^2$) and water density ($\rho \approx 1,000\text{ kg/m}^3$), normalized for liters ($1\text{ m}^3 = 1,000\text{ L}$).
- η (Overall System Efficiency): The cumulative efficiency factor, typically 50% to 70% for small micro-hydro systems. This encompasses:
- Penstock hydraulic efficiency: ~85%–92%
- Turbine hydrodynamic conversion: ~75%–85%
- Generator/alternator electrical conversion: ~80%–90%
- Drive transmission / belt coupling: ~95%–98%
Linear Proportionality and the Head vs. Flow Trade-Off
Output power is directly proportional to both Head and Flow ($P \propto H \times Q$):
- Doubling the net head doubles the electrical output for the exact same water volume.
- Doubling the water flow doubles the electrical output for the exact same vertical drop.
However, the physical design and economic tendencies differ noticeably between high-head and low-head configurations:
- High-Head, Low-Flow Sites (e.g., 50 m head, 5 L/s flow): High head creates intense water velocity ($v = \sqrt{2gH_{net}}$). Because the required water volume is small, it requires only a narrow, lightweight penstock (e.g., 50–75 mm HDPE pipe) and a compact impulse runner (such as a Pelton or Turgo wheel). As a general engineering tendency, electro-mechanical and conduit costs per kilowatt are typically lower; however, actual project cost depends heavily on site topography, terrain accessibility, and the penstock run length across steep cliffs or rocky terrain.
- Low-Head, High-Flow Sites (e.g., 3 m head, 85 L/s flow): Low head produces low water pressure. Generating identical electrical power requires routing massive volumes of heavy water. This generally demands wide-diameter penstocks or open flumes to minimize friction loss, larger intake structures, and physically heavier reaction turbines (such as Propeller, Kaplan, or Crossflow). Consequently, civil works and equipment expenses per installed kilowatt tend to be higher, though gentle roadside terrain or existing irrigation canal drops can sometimes offset excavation expenses.
A Practical Example Calculation
Suppose a mountain homestead has a stream with a 15-meter (49-foot) net head and an allowable diverted flow rate of 20 liters per second:
- Multiply gross hydrodynamic parameters:
$$15\text{ m} \times 20\text{ L/s} \times 9.81 = 2,943\text{ Gross Watts}$$ - Apply an estimated 60% cumulative system efficiency factor ($\eta = 0.60$):
$$2,943 \times 0.60 \approx 1,765\text{ Watts } (1.765\text{ kW})$$ - Steady-Flow Generation Potential:
When operating continuously at the design flow rate:
$$1.765\text{ kW} \times 24\text{ hours} = 42.36\text{ kWh per day}$$
$$42.36\text{ kWh} \times 30\text{ days} \approx 1,270\text{ kWh per month}$$
Critical Reality Check: Steady Flow vs. Annual Energy Yield (Illustrative Hydrological Scenarios):
While the theoretical mathematical output of 1.765 kW yields ~1,270 kWh/month under ideal steady flow, annual electricity production should never be calculated by simply multiplying rated power by 8,760 hours. In reality, total yearly output is dictated by site-specific seasonal hydrology, maintenance outages, and operational realities. The following scenarios represent illustrative engineering estimates based on catchment type, not guaranteed empirical constants:
- Stable Perennial Stream Scenario (Illustrative ~60%–80% Capacity Factor): On streams fed by year-round snowmelt or karst spring aquifers where discharge rarely falls below the turbine design threshold, a well-maintained plant can maintain steady output for most of the year (producing an illustrative ~9,200 to 12,300 kWh annually for a 1.76 kW unit).
- Seasonal Monsoonal / Rainfed Stream Scenario (Illustrative ~30%–50% Capacity Factor): In rainfed catchments where lean dry-season flow drops below minimum turbine operating levels for 4 to 6 months, real-world annual capacity factors frequently fall to 30%–50%, requiring battery storage or hybrid solar supplementation.
- Authoritative Industry Benchmark: In global renewable cost and performance databases published by the International Renewable Energy Agency (IRENA) (Renewable Power Generation Costs), run-of-river small hydropower facilities typically exhibit global weighted-average capacity factors between 45% and 55%, with individual site performance fluctuating entirely based on the local watershed's annual Flow Duration Curve.
2. Seasonal Hydrology: Rainy Season vs. Dry Season Water Availability
A common design pitfall is assuming that a stream maintains its measured flow rate year-round. Natural stream discharge fluctuates significantly between wet and dry seasons:
| Hydrological Period | Stream Characteristics & Flow Profile | Operational Opportunities & Technical Risks | Design & Engineering Safeguards |
|---|---|---|---|
| Rainy / Monsoon Season (High Peak Flow) | Discharge surges 5× to 20× above baseflow; high water levels, strong hydraulic turbulence, and surface runoff. | Abundant potential energy, but severe risk of hydro-abrasive sediment erosion (quartz sand/silt) damaging nozzles and runners. Flood debris can clog intakes; rising tailwater can submerge impulse runners and reduce effective net head. | Construct a settling basin (desilting chamber) with low velocity to precipitate abrasive sand particles (>0.2 mm); integrate self-cleaning Coanda intake screens and an automatic high-water overflow spillway. |
| Dry / Summer Season (Lean Baseflow) | Stream discharge drops to minimum baseflow, fed only by deep groundwater springs or receding snowmelt. | If the system is oversized based on average or wet-season flow, the intake will starve, drawing air into the penstock, causing turbine cavitation, electrical surging, and forcing system shutdown. | Evaluate turbine sizing against dry-season low-flow indicators (such as $Q_{80}$ or $Q_{90}$) alongside local electrical demand; install multi-nozzle manifolds that allow shutting off individual jets as seasonal flow declines. |
The Flow Duration Curve (FDC) and Sizing Considerations
To avoid building an oversized system that starves during lean months or an undersized plant that spills usable energy, hydrological feasibility studies utilize a Flow Duration Curve (FDC)—a graphical representation showing the percentage of time that specific streamflow rates are equaled or exceeded throughout a typical year:
- Hydrological Indicators ($Q_{80}$ / $Q_{90}$) vs. Site-Specific Design: Flow exceedance values such as $Q_{80}$ or $Q_{90}$ (the discharge exceeded 80% to 90% of the year) are widely used in engineering literature as useful hydrological indicators of firm baseflow, but they are not mandatory, universal sizing rules for every project. Determining the optimal design flow ($Q_{design}$) requires balancing multi-year flow-duration data, statutory ecological reserve mandates, the seasonal electrical demand profile of the home or community, and project economics. For instance, a grid-connected or hybrid system might be sized closer to median flow ($Q_{50}$) to maximize annual energy yield, whereas a standalone off-grid homestead without secondary backup often sizes closer to firm dry-season flow ($Q_{85}$–$Q_{90}$) minus environmental reserves to ensure uninterrupted baseload.
- Multi-Jet and Modular Flexibility: Using a turbine with multiple independently valved nozzles (e.g., a two- or four-nozzle Pelton or Turgo) enables operators to open all nozzles during monsoon months to capture higher output, and close one or more nozzles during dry months to maintain peak efficiency and prevent penstock dewatering.
- Hybrid System Integration: In regions with severe dry-season depletion, micro-hydro systems are frequently paired with solar photovoltaics. Because dry summer months in many climates coincide with cloudless, high-solar-irradiance conditions, solar and micro-hydro form a complementary year-round hybrid microgrid.
3. Major Components of a Run-of-River Micro-Hydro System
Micro-hydro setups almost universally use a run-of-river design, meaning water is temporarily diverted without building a massive concrete storage dam or flooding land:
| Component | Engineering Purpose |
|---|---|
| Diversion Weir & Intake | A small, low-impact rock or concrete barrier that diverts a controlled fraction of streamflow into the intake canal without obstructing the entire river cross-section. |
| Settling Basin (Desilting Chamber) | A widened, low-velocity basin equipped with a trash rack that allows suspended sand, silt, and abrasive quartz particles to settle out before water enters the pressure pipe. |
| Penstock (Pressure Pipe) | A durable high-density polyethylene (HDPE) or steel pressure pipe running downhill, converting gravitational potential energy into high-velocity kinetic pressure while preventing water hammer. |
| Powerhouse & Turbine Runner | Houses the turbine manifold, nozzles, shutoff valves, and runner wheel where water's hydraulic kinetic energy is converted into shaft torque. |
| Alternator / Generator | Converts rotational mechanical energy into single-phase or three-phase AC electricity at stable voltages. |
| Electronic Load Governor (ELG) & Dump Load | Because water flow through a run-of-river turbine cannot be throttled instantaneously without causing destructive pressure surges (water hammer), an ELG continuously diverts surplus electrical power to secondary resistive heating coils (e.g., domestic water or space heaters) to keep generator speed and grid frequency (50/60 Hz) perfectly constant. |
| Tailrace | A protected discharge channel that returns the diverted water cleanly back into the natural stream bed below the turbine. |
4. Turbine Categories: Impulse vs. Reaction
Turbine selection depends entirely on your site's specific combination of net head and available flow rate:
1. Impulse Turbines (Best for High Head, Low Flow)
In an impulse turbine, water passes through pressurized nozzles, converting potential pressure into high-speed atmospheric jets that strike curved buckets on a free-spinning runner open to air:
- Pelton Wheels: The classic choice for high-head installations (20 to 100+ meters) with low flow rates. Pelton runners use split-cup buckets that divide the jet and reverse its direction by nearly 180°, capturing up to 85%–90% of kinetic energy.
- Turgo Turbines: A variation of the Pelton wheel where the jet strikes the wheel at an angled plane (typically 20°). It handles up to three times the water volume of a Pelton runner of the same diameter, making it ideal for medium head ranges (12 to 35 meters) with moderate flows.
- Crossflow (Banki-Michell): Water flows transversely through a cylindrical drum with curved blades. Crossflow turbines accommodate wide seasonal flow variations and are highly tolerant of residual fine silt, making them popular for remote rural electrification.
2. Reaction Turbines (Best for Low Head, High Flow)
Reaction turbines remain completely submerged within a closed pressure casing; water flows over airfoil-shaped blades, generating rotational torque through fluid pressure drop and aerodynamic lift:
- Francis Turbines: Widely utilized in commercial small-hydro facilities with medium head (10 to 50 meters) and steady flow rates.
- Propeller / Kaplan Turbines: Ideal for very low-head sites (1.5 to 10 meters) with substantial water volume, such as canal drops, mill leats, and low-gradient rivers. Kaplan turbines feature adjustable runner blades to maintain high efficiency across fluctuating flows.
5. Environmental Safeguards, Competing Water Rights, and Site Limits
While micro-hydro systems generate zero greenhouse gas emissions during operation, they alter natural stream hydrology between the intake and the tailrace. Responsible design must adhere to strict ecological and legal boundaries:
1. Competing Water Rights and Downstream Human Needs
Water in an open stream is a shared communal and ecological asset. Hydro developers do not own the water—they merely borrow its energy:
- Prior Appropriation and Riparian Rights: Installations must comply with local water allocation laws. In many jurisdictions, downstream domestic drinking water supplies, livestock watering, and registered agricultural irrigation canals hold absolute legal priority over power generation.
- Agricultural Irrigation Conflicts: During sowing and dry-season cropping cycles, agricultural diversions can drop streamflow below operating thresholds. A micro-hydro facility must never infringe upon existing downstream irrigation or domestic entitlements.
- Statutory Permitting: Siting a run-of-river system typically requires water extraction licenses, riverbed work permits, and environmental impact notifications from regional water authorities.
2. In-Stream Environmental Flow (e-flow / Minimum Ecological Reserve)
The segment of natural riverbed between the intake diversion weir and the tailrace discharge is known as the bypassed reach:
- Never Divert 100% of Natural Flow: Diverting the entire flow of a stream desiccates the riverbed and irreversibly damages riparian ecology. Regulators strictly enforce an Environmental Flow (e-flow)—a baseline volume that must remain uninterrupted in the natural channel at all times.
- No Universal Percentage (Site-Specific Regulatory Mandate): There is no single universal percentage for environmental flow across all waterways. Statutory requirements depend entirely on local legislation, river basin management plans, and site-specific ecological assessments:
- India: For example, the National Mission for Clean Ganga (NMCG) under India's Ministry of Jal Shakti issued a landmark statutory notification (Gazette Notification S.O. 5195(E), formally monitored via the Central Water Commission) mandating specific seasonal e-flow requirements exclusively for the River Ganga basin (specifically: 20% of monthly average flow during the dry/lean November–March season, 25% during the lean-intermediate October and April–May months, and 30% during the high-flow June–September monsoon season). However, this specific regime applies only to the Ganga mainstem; other Indian rivers and Himalayan tributaries are regulated under independent state clearances (e.g., Himachal Pradesh or Uttarakhand state river policies).
- International Environmental Flow Frameworks: In other jurisdictions, regulators employ hydrological indices—such as the Tennant (Montana) method (which uses percentages of Mean Annual Flow as qualitative fisheries health indicators), the $Q_{95}$ standard (the flow exceeded 95% of the time, standard under the UK Environment Agency), or 7Q10 standards (the lowest 7-day average flow expected once in 10 years, referenced by the U.S. EPA).
- Practical Takeaway: Homeowners and small-scale developers must never apply an assumed fixed percentage. Consult local water resource departments, irrigation boards, or environmental conservation authorities to determine the legally binding e-flow threshold for the specific stream before sizing diversion weirs.
3. Aquatic Life Protection and Fish Passage
- Intake Screening and Approach Velocity Parameters: Diversion structures must prevent fish, fingerlings, and macroinvertebrates from being drawn into high-pressure penstocks (entrainment) or pinned against screen surfaces (impingement). While engineering guidelines frequently reference slot openings of 2 mm to 3 mm (such as on wedge-wire or Coanda-effect screens) and low approach velocities below 0.3 m/s as common benchmark criteria, these are not universal blanket standards. Exact screening aperture size and maximum allowable approach velocity must be engineered based on:
- Target Aquatic Species & Life Stages: Burst-swimming capabilities and physical dimensions vary substantially between adult fish, juvenile fry, and benthic organisms native to the specific watercourse.
- Debris and Silt Characteristics: In streams carrying heavy organic leaf litter or fine quartz sediment, screen sizing must balance fish protection against severe clogging risks, often incorporating automated air-burst or mechanical wiper cleaning systems.
- Regional Fisheries Regulatory Standards: Statutory environmental agencies (such as NOAA Fisheries in the United States or the Environment Agency in the UK) enforce specific biological criteria and screening design manuals tailored to local river species.
- Fish Migration Corridors: On streams supporting migratory fish species (such as trout, salmon, or native mahseer), diversion weirs must incorporate nature-like fish bypass channels, rock ramps, or fish ladders to preserve upstream and downstream migratory passage.
- Managing Water Quality, Sediment Dynamics, and Habitat Alterations: While run-of-river turbines consume no water and do not introduce toxic chemicals during normal operation (using sealed food-grade lubricants or water-lubricated bearings), their physical presence is not environmentally neutral. Run-of-river diversions can alter local stream processes:
- Dissolved Oxygen and Thermal Shifts: Water travelling through prolonged, dark, above-ground penstocks can experience slight temperature rises during warm summer months, while calm forebay ponding can impact dissolved oxygen levels. The tailrace must be aerated and discharge smoothly to prevent streambed scouring and restore oxygen saturation.
- Sediment Transport Interruption: Diversion weirs and desilting basins inevitably trap bedload sand, gravel, and organic nutrients. This disrupts downstream sediment replenishment, which can erode downstream channel beds and degrade spawning gravels essential for benthic organisms and fish.
- Bypassed Reach Ecological Stress: The reduced volume between the intake and tailrace increases water warming risks and shrinks the wetted perimeter of aquatic habitats during dry seasons, underscoring why legally mandated environmental reserves must never be compromised.
6. Micro-Hydro Capital Costs and Economic Benchmarks
Unlike mass-manufactured rooftop solar panels, micro-hydropower costs are predominantly site-specific civil engineering and topography costs. Total capital expenditure depends far more on available vertical head, penstock pipe length, and road accessibility than on turbine capacity alone.
Understanding Historical vs. Modern Cost Benchmarks (Scope and Scale Limitations)
When reviewing published figures from international agencies, homeowners and project planners must recognize critical distinctions in timing, project scale, and geographic scope:
- IRENA Historical Small-Hydropower Benchmark (2012 Working Paper — For Historical Context Only):
- In its foundational working paper Renewable Energy Technologies: Cost Analysis Series – Hydropower (Volume 1: Power Sector, Issue 3/5, Section 3, Table 3.1), IRENA surveyed capital investment across global hydropower facilities commissioned in earlier decades.
- Reported Historical Ranges: The 2012 paper documented historical installed capital costs between USD 1,000 and USD 3,000 per kW for small-scale hydro projects in developing economies with domestic manufacturing (such as China and India), and USD 2,000 to USD 7,500 per kW across OECD markets.
- Must Not Be Used as Modern Residential Quotes: These figures serve strictly as a historical reference benchmark from commercial-scale small-hydro facilities (primarily utility-scale small hydro up to 10 MW, and small mini-grids up to 1 MW) that benefited from significant economies of scale. They must never be treated as a contemporary pricing quote for current residential or small off-grid micro-hydro projects (<10 kW or <100 kW). Modern residential systems lack utility bulk-purchasing power, have experienced substantial inflation in civil labor and materials since 2012, and require bespoke on-site fabrication. Turnkey residential micro-hydro installed costs today frequently range significantly higher (often USD 4,000 to USD 8,000+ per kW depending on site accessibility).
- Current Global Hydropower LCOE Benchmark (IRENA 2024 / Published 2025):
- According to IRENA's latest flagship report, Renewable Power Generation Costs in 2024, the global weighted-average Levelised Cost of Electricity (LCOE) for newly commissioned hydropower projects was USD 0.057 per kWh.
- Hydropower remains among the most cost-competitive, dispatchable baseload renewables globally. However, for decentralized micro-hydro, the real-world LCOE is heavily sensitive to the local stream's annual capacity factor and financing rates: perennial streams with high utilization (>50%) achieve competitive generation costs (~USD 0.04 to USD 0.10/kWh), whereas seasonal streams with low capacity factors (<35%) or high loan interest rates will experience significantly higher unit costs.
- World Bank / ESMAP Mini-Grid Assessment:
- In its comprehensive global study Mini Grids for Half a Billion People: Market Outlook and Handbook for Decision Makers (ESMAP Technical Report 014/19), the World Bank examined off-grid rural electrification. While the report highlights solar-hybrid mini-grids as the fastest-growing modern technology, it emphasizes that small and micro-hydro mini-grids remain highly competitive in mountainous regions with perennial river flow. However, unlike modular solar-plus-storage, ESMAP notes that hydro capital expenditures cannot be standardized into uniform catalog prices due to heavy dependence on local geology, weir construction, and distribution line distances.
- Vertical Head as an Engineering Cost Tendency (Not a Blanket Guarantee):
- High-Head Sites (>25–30 meters): As a general engineering rule of thumb, high-head sites tend to exhibit lower specific cost per kW for electro-mechanical equipment and piping because high water pressure permits smaller-diameter HDPE conduits and compact impulse runners. However, this is not a universal constant: if a high-head site requires an exceptionally long penstock over precipitous, roadless terrain with extensive rock anchoring, total civil and installation costs can easily exceed low-head projects.
- Low-Head Sites (<10 meters): Generally exhibit higher equipment and civil costs per installed kilowatt because handling massive water volumes requires heavy reinforced-concrete intakes, wide penstocks or flumes, and larger runner assemblies. However, where an existing weir, mill race, or irrigation canal drop already exists, civil expenses drop dramatically. Actual cost per kW is always dictated by site-specific conditions rather than head alone.
What Is Included vs. Excluded in Installed Cost Benchmarks
Engineering manuals—including the UNIDO Small Hydropower Technical Guidelines and the Natural Resources Canada Micro-Hydro Guide—define the standard capital allocation for run-of-river installations:
- Typically Included in Turnkey Capital Benchmarks:
- Civil Works (~35%–45% of total budget): Diversion weir, intake canal, sediment settling basin (desilting chamber), penstock anchor blocks, powerhouse foundation, and tailrace discharge channel.
- Penstock System (~20%–30% of total budget): Pressure-rated HDPE or steel pipes, joint couplings, isolation gate valves, and air release valves.
- Electro-Mechanical Equipment (~25%–35% of total budget): Turbine runner, casing, alternator/generator, belt drive coupling, and electronic load governor (ELG) with dump-load heating elements.
- Basic Electrical Balance of System (~5%–10% of total budget): Main breaker panel, basic metering, and short-distance low-voltage wiring to the adjacent dwelling.
- Typically Excluded (Additional Site-Specific Expenses):
- Land acquisition, riparian rights purchases, or right-of-way easement fees across private land.
- Long-distance utility grid extensions (e.g., high-voltage transformer lines).
- Deep-cycle battery banks and hybrid inverters (required if off-grid storage is needed during seasonal low-flow periods).
- Environmental impact assessments, specialized hydrologic stream-gauging studies, and statutory legal permitting fees.
Authoritative Technical Guidelines & Direct Resources
- International Renewable Energy Agency (IRENA):
- Renewable Energy Technologies: Cost Analysis Series – Hydropower (Volume 1: Power Sector, Issue 3/5) — Supports historical small-hydropower capital cost ranges across developing and OECD markets (Table 3.1) and asset lifespan fundamentals.
- Renewable Power Generation Costs in 2024 — Supports the latest global weighted-average hydropower LCOE benchmark (USD 0.057/kWh) and global capacity factor trends.
- World Bank / ESMAP: Mini Grids for Half a Billion People: Market Outlook and Handbook for Decision Makers (Technical Report 014/19) — Official World Bank repository handle supporting analysis of decentralized mini-grid deployment, local site constraints, and the capital variability of rural run-of-river projects.
- U.S. Department of Energy (DOE): Types and Sizes of Hydropower Plants (Microhydropower Definition) — Official DOE classification defining microhydropower up to 100 kW for homes, farms, and villages.
- U.S. DOE Water Power Technologies Office (WPTO): Water Power Research, Deployment, and Technical Publications — Supports technical research on hydro-abrasive sediment erosion and intake screening standards.
- Ministry of New and Renewable Energy (MNRE), India: Small Hydro Power Programme Overview & Classification — Details the statutory categorization and administrative mandate for Small Hydro Power projects up to 25 MW in India.
- Ministry of Jal Shakti / Central Water Commission (CWC), India: Implementation of Minimum Environmental Flows in River Ganga (Gazette Notification S.O. 5195(E)) — Official statutory monitoring and compliance documentation for mandated seasonal e-flows.
- Food and Agriculture Organization (FAO): Water-Energy-Food Nexus Governance Framework — Supports agricultural run-of-river, gravity irrigation canal hydro integration, and competing water-rights principles.