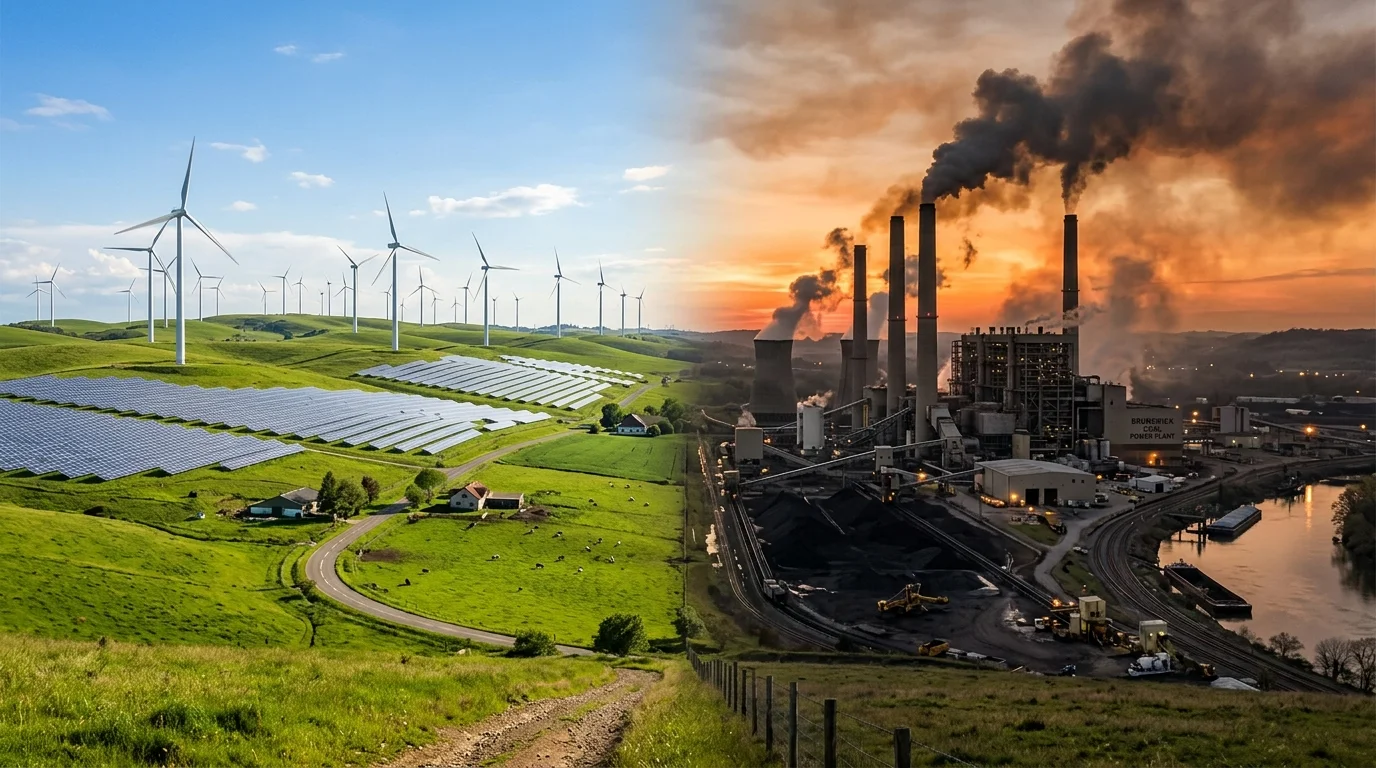
The global power sector is undergoing its most profound structural shift since the Industrial Revolution. For over a century, economic growth and electrification relied almost entirely on fossilized subterranean carbon deposits—coal, crude oil, and natural gas—mined or drilled from the earth's crust.
Today, imperatives surrounding climate change mitigation, urban air pollution, fuel supply volatility, and energy sovereignty are accelerating the global transition toward renewable energy.
However, distinguishing between renewable and non-renewable energy involves far more than slogans or simple binary classifications. A complete understanding requires evaluating the physical rate of resource replenishment, the thermodynamic nature of conversion, generation economics measured through Levelized Cost of Electricity (LCOE), financing and capital costs, and the technical complexities of integrating variable generation into modern transmission grids.
In this guide, we provide a balanced, evidence-based breakdown of both energy paradigms, grounded in benchmark data from international energy organizations.
1. Fundamental Definitions, Nuances & Boundary Conditions
At their fundamental physical level, the two energy categories are defined by their rate of natural replenishment relative to their rate of human consumption:
Renewable Energy
Renewable energy is harvested from natural, continuous environmental flows that replenish naturally on a human timescale. Because their primary energy drivers—thermonuclear fusion within the sun, gravitational forces between celestial bodies, atmospheric temperature differentials, and geothermal heat from the earth's mantle—are continuous, harvesting them today does not diminish their physical availability for future generations.
- Primary Generation Technologies: Solar Photovoltaic (PV) & Concentrating Solar Power (CSP), Onshore & Offshore Wind, Run-of-River & Reservoir-based Hydropower, Geothermal Systems, and Marine (Tidal & Wave) Energy.
- Bulk Energy Storage (Not a Primary Energy Source):
- Pumped-Storage Hydropower (PSH): PSH is fundamentally an energy storage technology rather than a primary energy source. It consumes off-peak or surplus electricity to pump water from a lower reservoir to an elevated upper reservoir, then releases it through hydro turbines to generate electricity during periods of high demand. Because it is a round-trip storage medium (operating at ~70%–80% round-trip efficiency) and creates no net primary energy, it serves the grid as bulk energy storage alongside Battery Energy Storage Systems (BESS).
- Important Technical Nuances & Limitations:
- Biomass: Organic matter (wood pellets, agricultural waste, biogas) is classified as renewable only when the rate of feedstock harvesting is strictly equal to or lower than the natural rate of biological regrowth. Moreover, the net climate impact of biomass depends heavily on avoiding indirect land-use change (ILUC), minimizing supply chain transport and pelletization emissions, and accounting for the "carbon payback time" (the multi-year to multi-decade delay before newly planted vegetation fully recaptures the carbon released during combustion).
- Geothermal Reservoirs: While the heat within the earth's core is effectively inexhaustible, individual hydrothermal steam and hot-water reservoirs can deplete or experience localized pressure/temperature drops if extraction rates exceed the natural recharge of underground aquifers.
- Large Hydropower: While water flow is cyclical, large reservoir-based hydro projects involve complex ecological impacts, reservoir siltation over multi-decade spans, and potential initial biogenic emissions from submerged decomposing biomass in tropical reservoirs.
Non-Renewable Energy
Non-renewable energy is extracted from finite terrestrial reserves that formed over tens to hundreds of millions of years through the anaerobic decomposition of ancient prehistoric flora and fauna under extreme subterranean heat and geological pressure. Once extracted and combusted, these finite chemical bonds are permanently depleted on any human timescale.
- Primary Technologies: Coal (Anthracite, Bituminous, Lignite), Petroleum / Crude Oil Derivatives (Diesel, Gasoline, Heavy Fuel Oil), and Natural Gas (primarily Methane - CH4).
- The Precise Classification of Nuclear Power & Nuclear Fuel:
- Nuclear power relies on finite geological uranium resources. In nature, uranium ore consists predominantly of non-fissile Uranium-238 (~99.3%), with fissile Uranium-235 accounting for only about 0.7%. Most conventional commercial reactors use fuel containing enriched uranium, specifically Uranium-235, which is capable of sustaining a controlled fission chain reaction. Because subterranean uranium deposits do not replenish on a human timescale, nuclear energy is technically classified as a non-renewable mineral resource.
- However, unlike fossil combustion, nuclear fission produces virtually zero direct operational greenhouse gas emissions during power generation. Furthermore, nuclear power generally achieves a high capacity factor, often exceeding 90% in well-maintained fleets and mature operating periods (according to IAEA and IEA tracking), though scheduled refueling outages and maintenance affect periodic availability. For this reason, energy scientists, the Intergovernmental Panel on Climate Change (IPCC), and the International Atomic Energy Agency (IAEA) classify nuclear power under the broader umbrella of "clean / low-carbon energy," distinguishing it sharply from carbon-emitting fossil fuels.
2. Direct Comparison Matrix
The table below contrasts the technical, environmental, and operational characteristics of both energy models:
| Attribute | Renewable Energy Sources | Non-Renewable Energy Sources |
|---|---|---|
| Resource Replenishment | Naturally continuous on a human timescale (sunlight, wind, hydrological cycle). | Finite geological reserves formed over millions of years; permanently depleted by extraction. |
| Operational Carbon Emissions | Zero direct combustion emissions at the point of generation (lifecycle footprint mostly in manufacturing). | High operational emissions of CO2, methane (from supply chains), SOx, NOx, and fine particulates (PM2.5). |
| Fuel Cost Volatility | Zero fuel cost for wind, solar, and hydro; fuel is an open environmental flow. | Subject to commodity price shocks, international freight logistics, and geopolitical cartels. |
| Cost Structure (CapEx vs OpEx) | Heavy upfront capital expenditure (80%–90% of lifetime cost) with very low, predictable operational costs. | Moderate initial build cost, but high ongoing fuel and variable operating expenditures over plant lifespan. |
| Dispatchability & Flexibility | Variable / intermittent for solar and wind; dispatchable for geothermal, biomass, and reservoir hydro (supported by energy storage systems like PSH and BESS). | Firm baseload capability, but ramping flexibility varies widely by technology (coal and nuclear have slow ramp rates and operational limits, while open-cycle gas peakers ramp rapidly). |
| Land Footprint | Higher surface area per megawatt generated (e.g., solar arrays, wind turbine spacing). | Compact generation plant footprint, but extensive land degradation across upstream mining and extraction. |
| Water Consumption | Negligible for solar PV and wind; closed-loop for modern geothermal systems. | Substantial withdrawal and consumption of freshwater for steam cycle cooling in thermal plants. |
3. Generation Economics: Demystifying LCOE, Financing, and System Costs
Over the past two decades, the cost trajectory of power generation technologies has undergone an unprecedented transformation. However, understanding energy costs requires looking beyond headline figures.
What is LCOE?
Energy economists and regulatory authorities evaluate generation economics using the Levelized Cost of Electricity (LCOE):
LCOE represents the average revenue per megawatt-hour that a generating plant must earn over its design life to break even, accounting for the time value of money.
Empirical Cost Declines (IRENA Benchmark Data)
According to authoritative benchmark reports published by the International Renewable Energy Agency (IRENA)—specifically Renewable Power Generation Costs in 2023 (published September 2024) and Renewable Power Generation Costs in 2024:
- Utility-Scale Solar PV: The global weighted-average LCOE of newly commissioned utility-scale solar PV plummeted by approximately 90% between 2010 and 2023, dropping from $0.460/kWh down to $0.044/kWh (approx. $44/MWh). In 2024 benchmarks, the global weighted-average utility-scale solar LCOE continued this cost trajectory at approximately $0.043/kWh.
- Onshore Wind: The global weighted-average LCOE dropped by approximately 70% over the 2010–2023 period, declining from $0.111/kWh down to $0.033/kWh (approx. $33/MWh). In 2024, the global weighted-average onshore wind LCOE was recorded at approximately $0.034/kWh. (Note: Historical literature citing ~67% generally reflected relative competitiveness against fossil fuel cohorts in earlier comparative studies rather than the direct nominal cost drop from 2010).
- Fossil Fuel Baselines & Regional Cost Variation: Unlike renewable energy, whose primary fuel is free, fossil fuel generation costs vary significantly across geographies, plant designs (subcritical coal, supercritical coal, combined-cycle gas vs. open-cycle peakers), localized fuel delivery logistics, and carbon compliance mechanisms. Across G20 and OECD markets, fossil-fired generation has historically operated in an illustrative range of $0.065 to $0.180+/kWh. This is not a universal benchmark; during fuel supply shocks or LNG spot market spikes (such as the 2022 global energy crisis), operational generation costs in import-dependent countries surged well above $0.25–$0.30/kWh.
What Stand-Alone LCOE Leaves Out: The "System Cost" Gap
While stand-alone LCOE demonstrates that utility-scale solar and wind are the cheapest sources of new bulk generation in history, LCOE measures costs only at the plant boundary (the generator busbar).
Stand-alone LCOE does not include the broader system costs required to integrate variable generation into an electric grid:
- Transmission Buildout: Solar and wind farms are frequently built in remote deserts or coastlines where solar irradiance or wind velocities are highest, necessitating high-voltage transmission lines to urban load centers.
- Balancing & Firming Capacity: When solar generation drops at sunset, other resources (such as flexible gas peakers, pumped storage, or batteries) must ramp up to maintain grid frequency.
- Curtailment Losses: In grids with high solar penetration, midday generation can exceed total power demand, forcing operators to curtail (shut down) zero-marginal-cost clean power.
To account for these integration realities, the International Energy Agency (IEA) developed VALCOE (Value-Adjusted LCOE), which combines pure generation cost with the temporal value, flexibility, and capacity contribution of each technology on the grid.
The Role of Financing (WACC)
Because renewable energy projects have zero fuel expenses but require large upfront capital investments, their LCOE is exceptionally sensitive to the Weighted Average Cost of Capital (WACC):
- In developed economies with low interest rates and stable policy environments (e.g., 4% to 5% WACC), solar LCOE can be under $0.035/kWh.
- In developing economies with higher perceived investment risk or high inflation (e.g., 9% to 12% WACC), the exact same solar panels and inverters can result in an LCOE nearly double that amount.
- Consequently, renewable energy is not automatically cheaper in every geography; access to low-cost financing is as critical as abundant sunshine or wind.
4. The Intermittency Challenge & The Evolution of "Baseload"
The fundamental operational difference between fossil combustion and variable renewables is dispatchability:
- Thermal & Nuclear Dispatchability: Thermal and nuclear plants can provide firm dispatchable power, but their operational flexibility and ability to ramp output vary widely by technology, plant design, age, operating conditions, and grid requirements:
- Coal-Fired Plants: Coal plants have minimum stable operating loads that vary by boiler design, fuel characteristics, plant age, and operating conditions. Operating below these limits may require additional combustion support or plant modifications, and frequent cycling can increase maintenance costs and thermal stress. While technical studies by the U.S. Department of Energy's National Energy Technology Laboratory (NETL) and the IEA cite typical ramp rates for pulverized coal plants between 2% and 5% of rated capacity per minute under active load-following conditions, actual flexible capability varies widely across plant vintages and operating regimes.
- Nuclear Fission Units: Many commercial reactors are operated near steady output to maximize the amortization of high initial capital expenditures and maintain stable reactor core neutronics (managing xenon-135 transient poisoning). However, several reactors and entire fleets (notably in France, where pressurized water reactors participate in frequency regulation and daily load-following, as documented by the IEA) possess technical maneuvering capabilities, demonstrating that nuclear power is not technologically limited to static output.
- Flexible Gas & Hydro: Open-cycle gas turbines (OCGTs) and reservoir hydro can start up and ramp within minutes to track sudden renewable fluctuations, though peaking gas units operate at lower thermodynamic efficiency and higher fuel costs.
- Variable Renewables: Solar PV generation fluctuates with daylight and cloud cover; wind generation fluctuates with localized atmospheric pressure gradients. Periods of stagnant wind combined with heavy overcast skies (known in energy engineering as dunkelflaute) can suppress renewable generation across broad regional territories for days at a time.
The Changing Concept of "Baseload"
Historically, electric grids were designed around static "Baseload Power"—large, slow-ramping coal or nuclear plants running at steady output day and night, supplemented by fast-ramping gas peakers or hydro during evening demand peaks.
In high-renewable power grids, the concept of static baseload is evolving toward system flexibility and dynamic balancing:
+------------------------------------------------------------------------+
|             HIGH-RENEWABLE GRID BALANCING ARCHITECTURE                 |
+------------------------------------------------------------------------+
| 1. High-Density Solar & Wind → Bulk daytime/seasonal energy supply|
| 2. Short-Duration BESS (2-4 Hours) → Fast frequency response & peak|
| 3. Long-Duration Storage (PSH / Flow) → Overnight & 8-24 hour firming|
| 4. Clean Firm Generation (Hydro/Nuclear/Geothermal) → Core baseline|
| 5. Inter-Regional Transmission → Moves surplus energy across zones|
| 6. Demand-Side Flexibility → Smart EV charging and industrial shift |
+------------------------------------------------------------------------+
Modern grid modernization demonstrates that variable renewables can provide the foundation of national energy supply, but doing so requires planning for total system reliability rather than assuming variable generators operate in isolation.
5. What This Means for Everyday Homeowners
The macroeconomic and technological transition from fossil fuels to renewables directly affects household energy economics:
- Hedge Against Fuel-Driven Tariff Inflation: Because utility-scale fossil plants must purchase coal or natural gas on volatile global markets, utilities pass these costs to domestic consumers via quarterly fuel surcharges (such as FPPPA or FAC). Installing residential rooftop solar locks in a predictable on-site electricity cost for 25+ years.
- Utility-Scale vs. Distributed Rooftop Solar Realities: Utility-scale solar projects achieve ultra-low LCOE (~$0.04 to $0.05/kWh globally) due to multi-megawatt bulk procurement, high-voltage grid interconnects, and single-axis trackers. In contrast, residential rooftop systems have higher balance-of-system (BoS), structural mounting, and permitting costs per installed kilowatt.
- International Benchmark (USD): In mature Western markets (e.g., U.S., Europe, Australia), IRENA and NREL data place the unsubsidized residential rooftop solar LCOE typically between $0.06 and $0.15/kWh, depending heavily on local labor, hardware, and soft permitting costs.
- Indian Context (INR): In India, lower domestic installation costs and central capital subsidies create a distinct financial landscape. For a typical 3 kW residential system subsidized under the PM Surya Ghar: Muft Bijli Yojana (which provides up to ₹78,000 in direct central subsidy), the levelized cost of generation is an illustrative ₹3.50 to ₹5.50/kWh under specific assumptions (25-year system design life, ~5.5% real discount rate, 0.5%–0.7% annual panel degradation, and net consumer capital outlay of approximately ₹65,000–₹95,000). This is an illustrative modeling range rather than a uniform benchmark across India; unsubsidized installations, varied regional irradiance, financing terms, and roof preparation costs will shift the actual levelized cost.
- Retail Tariff Arbitrage: Residential solar does not need to beat the wholesale utility-scale LCOE; it only needs to beat your local retail electricity tariff. For some households, rooftop solar can reduce long-term electricity costs, particularly when daytime self-consumption is high and installed system costs are competitive. In mature international markets, retail household rates often range between $0.12 and $0.30+/kWh. In India, upper telescopic residential slabs across urban DISCOMs (e.g., in Gujarat, Maharashtra, or Delhi) typically cost ₹6.00 to ₹9.00+/kWh once fuel adjustments (FPPPA), electricity duty, and fixed charges are factored in. However, actual savings depend on local tariffs, applicable subsidies, roof conditions, system performance, and the rules governing exported electricity.
- Net Metering & Self-Consumption: Grid-tied residential solar relies on regulated net-metering frameworks to offset daytime exports against nighttime consumption. To maximize investment returns, homeowners are increasingly adopting daytime self-consumption habits (running washing machines, pumps, and EV chargers during peak solar hours) to avoid selling surplus power at lower wholesale settlement rates.
- Contextual Environmental Impact & CO2 Savings: A standard 3 kW residential rooftop solar installation generates roughly 4,000 to 4,500 kWh annually under sunny climatic conditions. The actual carbon offset depends directly on the regional grid emission factor:
- India (CEA Official Database): In India, the Central Electricity Authority (CEA) publishes the CO2 Baseline Database for the Indian Power Sector. Under User Guide Version 19.0 (covering FY 2022–23), the national weighted-average grid emission rate was 0.719 tCO2/MWh (equivalent to 0.719 kg CO2/kWh) including renewable energy sources (RES), and 0.827 tCO2/MWh excluding renewables. Based on the grid-average factor (0.719 kg CO2/kWh), an illustrative 3 kW system generating roughly 4,200 kWh per year avoids approximately 3.02 metric tonnes of CO2 annually. Actual displacement will depend on the evolving grid generation mix in latest statutory releases (such as Versions 20.0 through 22.0).
- International Comparison: In power grids with higher baseline shares of hydro, nuclear, or renewables (such as France, Norway, or parts of Canada), the displaced emissions per kilowatt-hour are substantially lower (often 0.05 to 0.20 kg CO2/kWh).
- Actual generation and savings vary based on local solar insolation (GHI), roof orientation, tilt angle, ambient temperature coefficients, and panel cleanliness.
Related Guide: Calculate your home's solar investment with our Rooftop Solar Cost Breakdown Guide and estimate payback periods using our Rooftop Solar Savings Estimator.
Authoritative Standards & References
For comprehensive empirical datasets on global generation costs, energy transition metrics, and technology comparisons, consult the following official authorities:
- International Renewable Energy Agency (IRENA) — Renewable Power Generation Costs in 2023 — Authoritative global benchmark dataset detailing historical and technology-specific LCOE metrics.
- International Renewable Energy Agency (IRENA) — Renewable Power Generation Costs in 2024 — Latest global report tracking utility-scale solar PV ($0.043/kWh) and onshore wind ($0.034/kWh) benchmarks.
- International Energy Agency (IEA) — Projected Costs of Generating Electricity — Official report analyzing levelized generation costs and the Value-Adjusted LCOE (VALCOE) framework.
- National Renewable Energy Laboratory (NREL) — Annual Technology Baseline (ATB) — U.S. Department of Energy laboratory providing standardized LCOE modeling formulas, CapEx trajectories, and capacity factors.
- National Energy Technology Laboratory (NETL / U.S. DOE) — Technical reports on fossil plant cycling costs, ramp rates, and operational flexibility.
- Lazard — Levelized Cost of Energy+ — Annual industry benchmark analyzing unsubsidized LCOE and Levelized Cost of Storage (LCOS).
- Central Electricity Authority (CEA) — CO2 Baseline Database for the Indian Power Sector — Official Government of India statutory database detailing grid emission factors (User Guide Version 19.0, FY 2022–23).
Related Guides & Deep Dives
- On-Grid vs Off-Grid vs Hybrid Solar Systems: Complete Comparison — Detailed breakdown of equipment costs, battery lifespans, and operational pros and cons.
- Net Metering Explained: How Rooftop Solar Credits Work — Complete guide to bidirectional meters, credit rollover, and DISCOM surplus settlement.
- How to Calculate Electricity Cost of Any Appliance — Step-by-step formulas to calculate power consumption and operating expenses.
- Wind Energy Fundamentals: Small Wind Turbines for Home and Community — Practical guide to small wind turbine sizing, capacity factors, and micro-siting.
Conclusion
The transition from non-renewable to renewable energy is neither a simple environmental moral choice nor an overnight switch. Non-renewable fossil resources provided the energy density and dispatchable power that built the modern world, but their finite geology, environmental externalities, and fuel price volatility pose growing systemic risks.
At the same time, renewable energy technologies are now the lowest-cost source of bulk electricity in history. Achieving a fully decarbonized energy future requires understanding both sides: deploying abundant, low-cost solar and wind while simultaneously investing in the transmission networks, energy storage, clean firm generation, and flexible grid systems needed to keep modern power reliable around the clock.