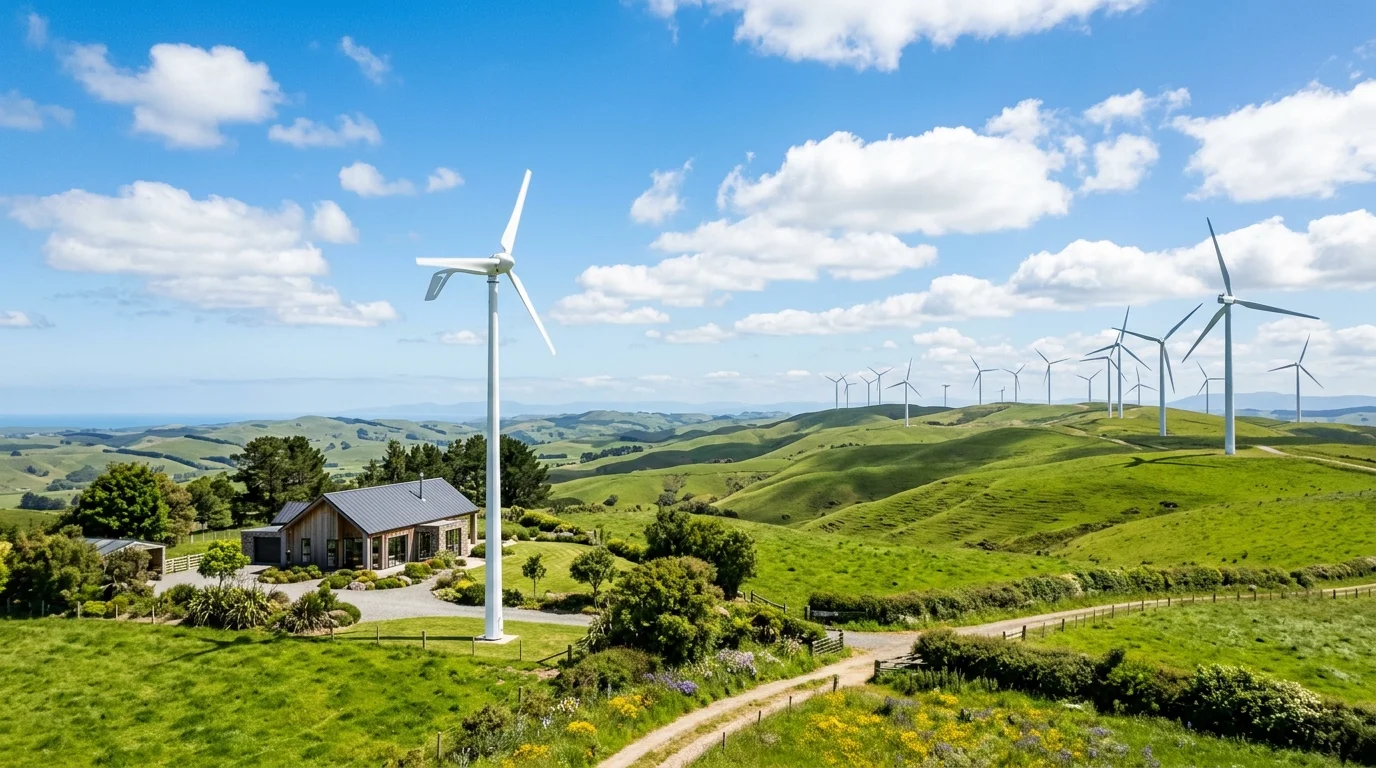
While solar photovoltaic panels are the most common form of residential renewable energy, wind energy represents one of the most powerful clean power resources on earth. For homeowners, small farms, and rural communities with adequate open land and strong wind resources, small wind turbines can generate clean electricity day and night, including during overcast winter months when solar generation is at its seasonal low. The IEC 61400-2 standard addresses the safety, engineering integrity, and design requirements of small wind turbines. Its exact scope and applicability should be checked against the relevant edition of the standard; rotor swept area alone does not describe every requirement or classification.
However, small wind energy is governed by strict aerodynamic principles and physical constraints. Unlike rooftop solar panels, which generate power predictably even under diffuse daylight, wind turbines require a minimum threshold of wind speed (the cut-in speed) to begin generating electricity, and their power output fluctuates with the cube of wind speed.
This guide explains how wind turbines convert kinetic energy, clarifies the crucial engineering differences between wind speed, nameplate turbine capacity, and actual energy yield, breaks down capacity factors, examines land, grid, and intermittency constraints, and evaluates hybrid wind-solar configurations.
1. How Wind Turbines Convert Kinetic Energy
Wind is air in motion, driven by uneven solar heating of the Earth's atmosphere, the Coriolis force of planetary rotation, and regional topographical gradients.
A wind turbine captures the kinetic energy of moving air masses using aerodynamic rotor blades shaped with an airfoil cross-section (similar to aircraft wings). As air streams across the blade, the pressure difference between the upper and lower surfaces creates aerodynamic lift, overcoming drag and forcing the rotor to rotate. The spinning rotor turns a main shaft connected to a permanent magnet generator (or through a step-up gearbox in larger commercial units) to produce electricity.
Theoretical Power in the Wind vs. Actual Output
The theoretical mechanical power naturally available in an open airstream is governed by fluid dynamics:
$$P_{wind} = \frac{1}{2} \rho A v^3$$
Where:
- $\rho$ (Rho): Air density (approximately
1.225 kg/m³at sea level, 101.3 kPa, and 15°C). Air density decreases with higher elevation and warmer temperatures, directly reducing the kinetic energy carried by the wind. - $A$: Rotor swept area in square meters ($A = \pi r^2$, where $r$ is the blade radius). Under IEC 61400-2 design safety standards, small wind turbines encompass swept areas up to $200\text{ m}^2$. Doubling the blade radius quadruples the swept area ($2^2 = 4$).
- $v$: Instantaneous wind speed in meters per second (m/s).
Important Engineering Reality: The equation above describes the theoretical kinetic power contained within the moving air mass, not the electricity delivered to your home. A turbine's actual electrical generation cannot be derived by simply plugging wind speed into this raw formula. Real-world output depends on the turbine's certified aerodynamic power curve, blade profile efficiency ($C_p$), generator and controller conversion efficiencies, mechanical operating limits, and site-specific air density.
The Betz Limit (59.3%) and Practical Conversion Efficiency
In 1919, German physicist Albert Betz formulated the theoretical maximum efficiency achievable by any open-flow wind turbine. Known as the Betz Limit, no turbine rotor can convert more than 16/27 (59.3%) of the kinetic energy in the wind into mechanical shaft power.
If a turbine rotor were 100% efficient, it would extract all kinetic energy, completely halting the air downstream. Because incoming air must have a pathway to exit behind the rotor, practical air deceleration limits maximum aerodynamic energy capture to 59.3%.
In its Small Wind Electric Systems Guidebook, the U.S. Department of Energy (DOE) notes that practical power coefficients ($C_p$) across varying rotor designs and operating conditions typically range between 0.25 and 0.45 (25% to 45%), well below the 0.59 theoretical ceiling:
- Commercial multi-megawatt utility turbines—equipped with tall towers, active aerodynamic pitch control, and custom blade aerofoil geometry—can achieve peak design $C_p$ values near 0.45 to 0.50.
- Residential and small-scale wind turbines typically operate with peak $C_p$ values between 0.25 and 0.38 due to smaller blade scales, fixed blade pitch, lower Reynolds numbers, and tip losses.
- Crucial note: These figures represent illustrative engineering ranges under optimal design wind speeds; actual $C_p$ fluctuates continuously across the turbine's operating curve and varies significantly by rotor design, wind regime, and maintenance state.
Critical Operational Wind Speed Thresholds
Small wind turbines are designed around distinct velocity regimes defined in their technical specifications:
| Speed Parameter | Typical Velocity (m/s) | Velocity (km/h / mph) | Mechanical & Electrical Behavior |
|---|---|---|---|
| Cut-in Speed ($v_{in}$) | 2.5 – 3.5 m/s | 9 – 13 km/h (5.5 – 8 mph) | Aerodynamic lift overcomes mechanical inertia and generator cogging torque. The rotor begins rotating and generates a modest trickle of net electricity. |
| Rated Wind Speed ($v_{rated}$) | 10.0 – 12.0 m/s | 36 – 43 km/h (22 – 27 mph) | The turbine reaches its full rated nameplate electrical capacity (e.g., 3 kW, 5 kW, or 10 kW). |
| Furling / Governing Speed | 12.0 – 16.0 m/s | 43 – 58 km/h (27 – 36 mph) | Passive aerodynamic mechanisms (tail-vane furling or blade pitch flutter) tilt the rotor away from the wind vector to limit mechanical stress and prevent generator overheating. |
| Cut-out Speed ($v_{out}$) | 20.0 – 25.0 m/s | 72 – 90 km/h (45 – 56 mph) | Protective braking systems (mechanical disk brakes, dynamic short-circuit generator braking, or aerodynamic stall) engage to stop rotation and prevent structural damage during severe storms. |
Operational Speed Siting Note: These are illustrative ranges, not universal specifications. Actual operating speeds, governing thresholds, and protection mechanisms vary significantly by turbine model and rotor engineering; always consult the manufacturer's certified technical documentation. The U.S. Department of Energy (DOE) Small Wind Guidebook serves as an authoritative reference for evaluating turbine performance, site assessment, and power curves.
2. Separating Fundamentals: Wind Speed, Turbine Capacity, and Actual Energy Yield
A pervasive source of confusion among prospective renewable energy adopters is conflating wind speed, nameplate turbine capacity, and actual annual energy production. These three parameters describe fundamentally different physical quantities:
[ Instantaneous Wind Speed (v, m/s) ]
            │
            ▼  (Cubic v³ power sensitivity & local Weibull distribution)
[ Turbine Nameplate Capacity (kW) ]  ──► Reached only at high rated wind (~10.5–12 m/s)
            │
            ▼  (Integrated over 8,760 hours across certified power curve)
[ Actual Annual Energy Yield (kWh) ] ──► Real kilowatt-hours delivered to the property
1. Wind Speed ($v$, m/s or km/h): The Stochastic Fuel Resource
Wind speed is the raw kinetic resource. Because available power scales with the cube of wind speed ($v^3$), wind power is hyper-sensitive to velocity fluctuations:
- A wind speed of 5 m/s yields a relative power factor of $5^3 = 125$.
- A wind speed of 10 m/s yields a relative power factor of $10^3 = 1,000$ (8 times more power for just a doubling of velocity).
Because natural wind fluctuates continuously, relying on a simple "annual average wind speed" can be misleading. Two sites with the exact same 5.0 m/s average speed can produce vastly different energy yields depending on their Weibull probability distribution (the statistical frequency of high-speed gust hours versus calm lull hours).
2. Turbine Nameplate Capacity ($P_{rated}$, kW): The Peak Hardware Rating
A turbine's nameplate capacity (e.g., "5 kW turbine") represents the electrical output delivered strictly at the manufacturer's rated wind speed—typically between 10.5 m/s and 12.0 m/s (38–43 km/h).
A 5 kW turbine does not generate 5 kW continuously. At wind speeds of 4.5–5.5 m/s, a turbine's electrical output can be substantially below its rated capacity. The actual percentage depends on the model-specific power curve, air density, turbulence, and operating conditions. Use independently tested performance data where available rather than a general percentage estimate.
3. Actual Energy Production ($E$, kWh/year): The Real-World Output
Actual generation is the cumulative electrical energy (in kilowatt-hours) delivered across the 8,760 hours of the year. It is calculated by integrating the turbine's certified power curve $P(v)$ with the site-specific wind velocity frequency distribution $f(v)$:
$$E_{annual} = 8,760 \times \int_0^{\infty} P(v) \cdot f(v) , dv$$
Where:
- $P(v)$ is the electrical power output at wind speed $v$, determined according to standardized power performance test procedures (such as IEC 61400-12-1).
- $f(v)$ is the probability density function (typically a site-calibrated Weibull or Rayleigh distribution) of hourly wind speeds at hub height.
Note on Performance Deratings: Certified power curves published by reputable manufacturers or testing bodies (such as the ICC Small Wind Certification Council) typically reflect net electrical output at standard test conditions. However, project planners must account for site-specific factors—including local obstacle turbulence, elevated temperatures, wiring voltage drop, and routine maintenance downtime.
3. Capacity Factor vs. Installed Capacity (Debunking the 8,760-Hour Fallacy)
The most critical metric evaluating any power generator is its Capacity Factor (CF)—the ratio of actual energy produced over a year to the theoretical energy that would have been produced had the generator operated at its maximum nameplate capacity continuously for all 8,760 hours:
$$\text{Capacity Factor (%)} = \frac{\text{Actual Annual Generation (kWh)}}{\text{Nameplate Capacity (kW)} \times 8,760\text{ hours}} \times 100%$$
The 8,760-Hour Rookie Calculation Mistake
Uninformed buyers frequently make the erroneous assumption that multiplying installed capacity by 8,760 hours gives expected annual yield:
$$\text{Erroneous Projection: } 5\text{ kW} \times 8,760\text{ hours} = 43,800\text{ kWh per year}$$
In practice, a 100% capacity factor is not a realistic expectation for typical wind-resource-driven projects. Actual capacity factor depends on the wind resource, turbine power curve, downtime, and site conditions. Wind regularly drops below the cut-in threshold, blows at moderate speeds where output is partial, or exceeds cut-out thresholds during storms.
Illustrative Scenarios: Mathematical Yield Across Capacity Factors
As emphasized in the U.S. Department of Energy (DOE) Small Wind Electric Systems Guidebook, real-world annual electricity production is driven by four primary site and equipment variables: the local wind resource, tower hub height, the turbine's certified power curve, and obstacle siting clearance.
The table below illustrates purely mathematical energy yields across hypothetical capacity factor ranges for a standard 5 kW nameplate rating ($5\text{ kW} \times 8,760\text{ hours} \times CF$). These figures represent mathematical modeling benchmarks, not empirical performance guarantees for any specific turbine model:
| Hypothetical Operational Context | Representative Hub Height Context | Hypothetical Capacity Factor | Mathematical Annual Yield (5 kW Rating) |
|---|---|---|---|
| Low-Resource / Marginal Inland Setting (~4.0–4.5 m/s avg) | 10 – 18 meters | 8% – 12% | 3,504 – 5,256 kWh / year (Sub-economic) |
| Viable Open Rural / Agricultural Setting (~5.0–6.0 m/s avg) | 24 – 36 meters | 14% – 20% | 6,132 – 8,760 kWh / year (Typical target) |
| Exceptional Coastal / Ridge Setting (>6.5 m/s avg) | 30 – 42 meters | 20% – 26% | 8,760 – 11,388 kWh / year (Upper tier) |
| Commercial Utility-Scale Comparison (Multi-Megawatt) | 100 – 150 meters | 35% – 50% | 15,330 – 21,900 kWh / year (scaled per 5 kW) |
| Rooftop Solar PV Comparison (Moderate to High Sunbelt) | Roof plane | 15% – 22% | 6,570 – 9,636 kWh / year (5 kW PV array) |
Critical Planning Reality: The mathematical outputs above demonstrate how capacity factor dictates actual energy capture ($5\text{ kW} \times 8,760\text{ h} \times 14% = 6,132\text{ kWh}$, whereas at $20%$ it reaches $8,760\text{ kWh}$). In practice, a turbine's real yield is not fixed by general industry averages; it varies dynamically based on the specific turbine model, hub-height wind speed frequency distribution, terrain roughness, and micro-siting. Before investing in equipment, homeowners should obtain a site-specific energy yield estimate calculated from the manufacturer's certified power curve and localized wind data.
4. Why Tower Height is Decisive: Wind Shear, Roughness, and Obstacle Clearance
Near the earth's surface, terrain friction, forest canopies, houses, and fences create a stagnant boundary layer of surface roughness. This drags down wind velocity and creates violent rotational eddies (turbulence):
Height (m)
   ▲
40 ┼──────────────────────── Higher Velocity, Smoother Airflow
   │
30 ┼──────────────────────── Recommended Hub Height Range
   │
20 ┼─────── 9m Clearance ──── Siting Buffer (DOE 30/500 Recommendation)
   │        ▲
10 ┼────────┼─ Obstacle ──── Surface Boundary Turbulence (High Fatigue, Low Energy)
   │        ▼
 0 ┴────────┴─────────────── Ground Level / Trees & Structures
The Wind Shear Power Law
As elevation above ground increases, wind velocity increases predictably according to the Hellmann Wind Shear Power Law:
$$v_2 = v_1 \left( \frac{h_2}{h_1} \right)^\alpha$$
Where:
- $v_1$ and $v_2$ are wind speeds at heights $h_1$ and $h_2$.
- $\alpha$ (Alpha) is the surface roughness friction coefficient (
0.10over smooth open water;0.15over flat agricultural terrain;0.25to0.40over wooded or suburban terrain).
Because kinetic power in the wind increases with $v^3$, raising a turbine from 10 meters (33 ft) to 30 meters (100 ft) in typical countryside ($\alpha \approx 0.20$) increases wind speed by approximately 24.6% ($3^{0.20} \approx 1.246$). Cubing this velocity ratio ($1.246^3 \approx 1.93$) yields roughly a 90% increase in theoretical wind power under this simplified model. However, actual annual electrical energy yield will depend on the turbine's specific power curve, mechanical cut-out thresholds, turbulence intensity, and local atmospheric stability conditions.
The 30/500 Siting Guidance
In its Small Wind Electric Systems Guidebook, the U.S. Department of Energy (DOE) provides the widely referenced 30/500 Siting Guidance (an engineering siting recommendation, not a statutory law):
- The lowest point of the turbine's rotor blade tip should ideally clear the tallest obstacle (tree canopy, barn, or ridgeline) within 150 meters (500 feet) by at least 9 meters (30 feet) to ensure clean, laminar airflow.
- Rooftop-Mounted Turbines: The DOE and wind engineers strongly caution against mounting small wind turbines directly onto residential rooftops. Building structures divert horizontal wind upward, creating turbulent vortices and dead zones directly above the roof ridge. Furthermore, mechanical vibrations and low-frequency acoustic pulsations can transmit directly into the home's structural framing.
5. Physical, Electrical, and Grid Limitations of Small Wind
Before investing in small wind technology, project developers and homeowners must account for physical, regulatory, and electrical boundaries:
1. Land Acreage, Setbacks, and Permitting
Small wind turbines require dedicated open land for safe tower erection, foundation anchoring, and guy-wire radius (if applicable):
- Setbacks and Municipal Permitting (Illustrative Siting Guidance): As emphasized in the DOE Small Wind Guidebook, property-line setbacks, maximum allowable tower heights, sound emissions criteria, and building permits are governed strictly by local municipal zoning authorities and regional electrical codes, not universal national mandates. As an illustrative planning example, some jurisdictions apply a fall-radius buffer requiring the tower base to sit at a distance of 1.1 to 1.5 times the total turbine height (tower plus blade tip) from adjacent property lines, overhead utility lines, and neighboring occupied dwellings. However, exact requirements vary widely by locality, property topography, and tower engineering (freestanding vs. guyed).
- Property Size Considerations: While parcel sizes of 1.0 to 2.0+ acres (0.4 to 0.8+ hectares) are frequently cited in planning literature as illustrative examples to accommodate setback buffers and minimize wake disturbance from nearby trees or structures, actual site suitability depends entirely on the specific tower design, site topography, surrounding obstacles, and local zoning permissions.
- Multi-Turbine Array Spacing: If installing multiple turbines on a community microgrid, engineering guidelines typically recommend spacing units 7 to 10 rotor diameters ($D$) downwind and 3 to 5 rotor diameters ($D$) crosswind to prevent upstream blade wakes from disrupting downstream units.
2. Overspeed Protection, Inverters, and Dump Loads
Connecting a wind turbine to an electrical distribution system requires specialized power conditioning and protective strategies:
[ Wind Turbine Generator ]
       │  (Wild Variable 3-Phase AC)
       ▼
[ Rectifier & Control System ] ◄───► [ Protection Strategy: Mechanical Brake / Furling / Dump Load ]
       │
       ▼  (Regulated DC)
[ Wind-Rated Inverter ] ───► [ AC Panel & Grid / Battery Storage ]
Electrical System Architecture & Grid-Interconnection Standards: Unlike solar panels (which output relatively steady direct current), wind generators typically produce variable-voltage, variable-frequency alternating current that changes continuously with wind gusts. Small wind systems may use rectifiers, controllers, batteries, and wind-rated inverters, depending on the generator and system architecture. Follow the turbine manufacturer's specified electrical configuration and protection requirements. While North American installations cite standards like IEEE 1547 (for interconnection) and UL 1741 (for inverter safety and anti-islanding protection), these serve primarily as U.S. engineering examples; international and Indian project owners must verify compliance with local electricity distribution companies (DISCOMs), State Electricity Regulatory Commissions (SERCs), and Central Electricity Authority (CEA) Technical Standards for Grid Connectivity.
Overspeed Protection and Dump Loads: Wind turbines need a reliable protection strategy for grid outages, controller faults, and high-wind storm conditions. Depending on the turbine and system design, protection may involve:
- Aerodynamic furling (tilting the rotor away from the wind vector)
- Mechanical or aerodynamic blade braking
- Dynamic electrical shorting across generator coils
- A resistive dump load (ceramic heating elements or water heaters) to divert surplus power
Off-grid battery-based systems frequently employ a dump load to absorb excess generation once batteries reach full charge. However, a dump load is not a universal requirement for every certified wind installation; system designers must follow the turbine manufacturer's instructions and applicable local electrical codes.
3. Intermittency, Cubic Drop Sensitivity, and Weather Patterns
- Cubic Drop Sensitivity: Because power scales with $v^3$, a 50% decrease in wind speed (from a strong 10 m/s breeze to a gentle 5 m/s breeze) results in an 87.5% drop in available kinetic power ($0.5^3 = 0.125$).
- Synoptic Weather Variations: Wind resources are subject to regional weather patterns, including calm seasonal periods where surface winds remain below cut-in speed for extended intervals.
- Storage Sizing and Hybrid Balancing: Standalone off-grid systems relying solely on wind require substantial battery capacity to bridge low-wind periods. Where solar and wind generation patterns complement each other, a hybrid solar-wind system can improve power reliability and reduce battery storage requirements; however, overall cost-effectiveness and optimal battery sizing depend heavily on local resource balance and system design.
6. Comparing Small Wind vs. Rooftop Solar
For the majority of distributed energy users, rooftop solar photovoltaic technology offers distinct financial and mechanical advantages, while small wind excels under specific geographical conditions:
| Design & Economic Feature | Rooftop Solar Photovoltaic (PV) | Small Residential Wind (3–10 kW) |
|---|---|---|
| Mechanical Complexity | Solid-state (Zero moving parts) | Dynamic (Rotor bearings, yaw swivel, blades, brakes) |
| Generation Profile | Strictly daytime (peaks at midday solar noon) | 24/7 intermittent (varies by weather and season) |
| Capacity Factor Range | 15% – 22% (predictable by season) | 10% – 20% (stochastic, hyper-dependent on tower height) |
| Maintenance Demands | Low (occasional dust/leaf washing) | Moderate (annual mechanical inspection, lubrication, bolt torque check) |
| Zoning & Permitting Barrier | Minimal in most residential areas | Substantial (height limits, sound ordinances, fall setbacks) |
| Siting Footprint Required | Existing roof surface | 1.0 to 2+ acres of open rural land for freestanding tower |
| Indicative Installed Cost ($/Watt)* | ~$1.00 – $1.80 / Watt | ~$4.00 – $8.00 / Watt (including tower, foundation, and trenching) |
*Note on Installed Costs: Cost figures above represent indicative estimates for the U.S. and developed residential markets derived from DOE and NREL distributed wind market reports. Actual costs vary widely based on turbine scale, tower construction (guyed vs. freestanding lattice), foundation excavation, permitting, and grid connection fees. Readers in India and other developing economies should not draw direct local cost or payback conclusions from USD benchmarks, as domestic equipment, local labor, and balance-of-system structures differ significantly.
The Complementary Synergy of Hybrid Solar-Wind Systems
Rather than competing, solar and wind can form an effective Hybrid Microgrid:
- Seasonal Balance: In many continental and temperate regions, summer brings high solar irradiance but lower average winds. In contrast, winter brings heavy cloud cover and short daylight hours, but stronger seasonal winds.
- Site-Specific Diurnal Complementarity: While solar produces strictly between sunrise and sunset, nocturnal wind patterns vary by location. Over flat open plains, low-level wind speeds may increase after dusk as surface layers decouple; conversely, sheltered valleys often experience nocturnal calms. Where complementary patterns exist, combining wind and solar into a shared battery bank reduces the total battery capacity required for reliable year-round power.
7. Authoritative Technical Guidelines & Verified Resources
For project planners, engineers, and property owners evaluating wind feasibility, consult the following official technical repositories and standards:
- U.S. Department of Energy (DOE) - WindExchange: Small Wind Electric Systems Guidebook — Comprehensive federal guidance on site evaluation, tower height recommendations (including the 30/500 guideline), permitting, and system economics.
- Global Wind Atlas (DTU Wind Energy / World Bank): Global Wind Resource Mapping and GIS Data — High-resolution international wind resource dataset. (Note: The Global Wind Atlas is designed for preliminary macro-level screening; due to terrain modeling uncertainties, it does not replace on-site anemometer measurements for project financing).
- U.S. Department of Energy (DOE) - CMEI / WETO: Small and Distributed Wind Systems Overview and FAQs — Official federal guidance on distributed wind definitions (<100 kW), typical capacity factors (10%–20%), and technological components.
- National Institute of Wind Energy (NIWE), Ministry of New and Renewable Energy, India: Indian Wind Potential and Resource Assessment Portal — Official Indian wind monitoring data, hub-height resource assessments, and turbine testing protocols.
- International Electrotechnical Commission (IEC): IEC 61400-2: Small Wind Turbines Safety and Engineering Requirements — The foundational international standard (IEC 61400-2:2013) addressing safety integrity, structural design, and engineering requirements for small wind systems.
- International Renewable Energy Agency (IRENA): Renewable Power Generation Costs in 2024 — Global benchmarks for onshore wind capacity factors, levelised cost of electricity (LCOE), and capital cost trends.