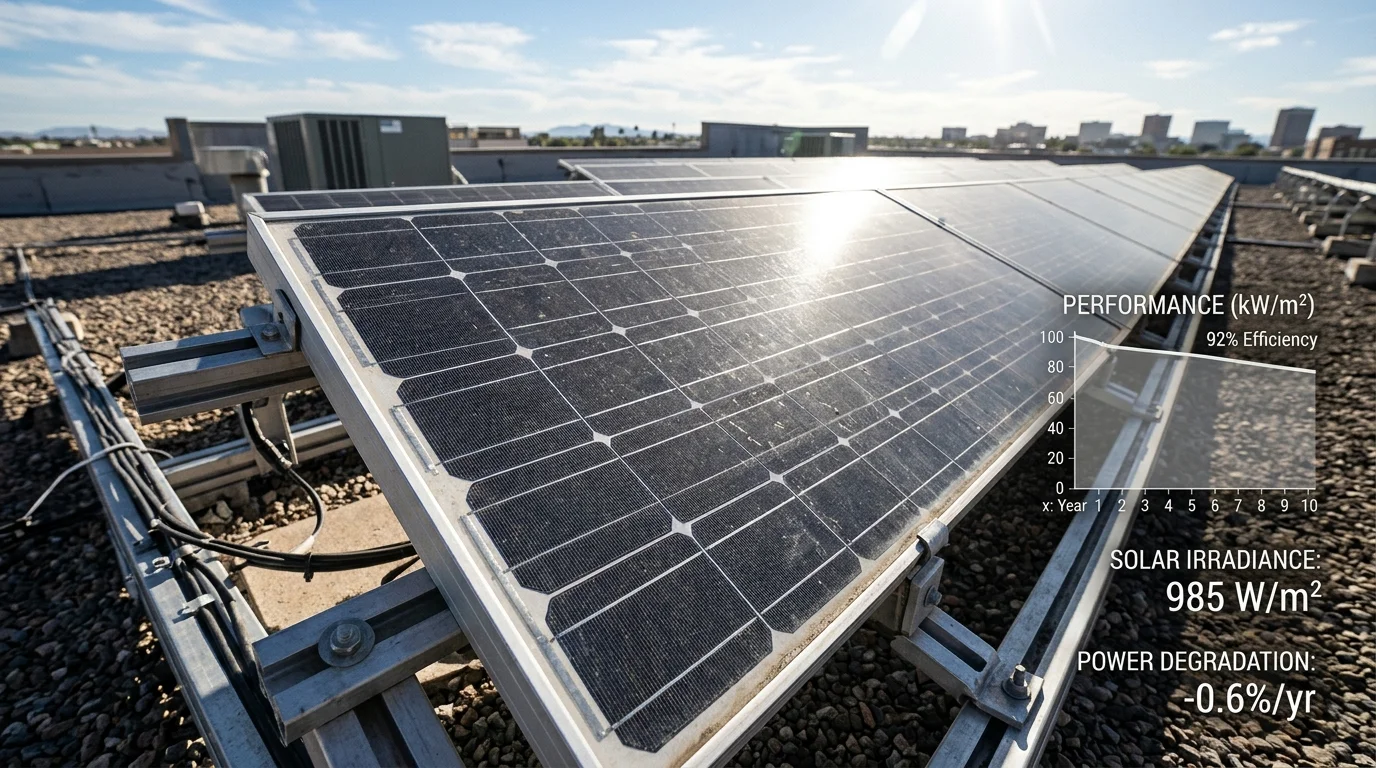
When investing in a rooftop solar photovoltaic (PV) system, prospective buyers are frequently presented with a reassuring promise: “These panels carry a 25- to 30-year performance warranty.” While this warranty provides legal protection against abnormal generation collapse, it often leads to a common misconception—that solar panels will generate the exact same amount of kilowatt-hours (kWh) on day 10,000 as they did on their first afternoon of commissioning.
In reality, photovoltaic modules generally experience gradual long-term performance degradation during outdoor operation. Although many degradation mechanisms cause permanent material changes, certain electrical degradation effects can be partially reversible under specific conditions. Just as rechargeable battery cells gradually lose maximum charge capacity through electrochemical cycling, solid-state semiconductor silicon wafers and their protective polymer encapsulants slowly undergo structural and chemical alteration under continuous outdoor exposure.
Understanding the mechanics of solar panel degradation is essential for evaluating long-term financial returns, setting realistic solar savings expectations, and distinguishing between harmless environmental aging and actionable equipment failure.
1. What Is Solar Panel Degradation?
Solar panel degradation is the gradual reduction in a photovoltaic module's electrical power output (Pmax) over its operating lifetime. Depending on the underlying mechanism, some degradation may be permanent, while certain electrical degradation effects can be partially reversible under specific conditions.
When a photovoltaic module is manufactured, its nominal peak power rating (e.g., 400W, 540W, or 580W) is determined in a factory flash test under Standard Test Conditions (STC):
- Irradiance: 1,000 Watts per square meter (W/m²)
- Cell Junction Temperature: 25°C (77°F)
- Air Mass Spectral Distribution: AM 1.5G
As documented by the NLR Solar Research Portal (formerly NREL) and the U.S. Department of Energy (DOE), outdoor rooftop conditions rarely match STC. Modules are subjected to solar ultraviolet (UV) radiation, continuous thermal cycling (-5°C winter nights to +75°C summer cell temperatures), atmospheric moisture, airborne pollutants, and wind-induced mechanical stress. Over years, these stressors induce atomic-level defect centers in the silicon lattice and degrade polymer layers, leading to a measurable decline in efficiency.
Temporary Performance Loss vs. Long-Term Degradation
Before evaluating degradation, it is vital to separate reversible generation dips from long-term degradation mechanisms:
| Attribute | Temporary / Reversible Performance Loss | Long-Term Degradation |
|---|---|---|
| Primary Causes | Soiling (dust, bird droppings, soot), seasonal tree shading, passing cloud cover, midday cell heat derating. | Semiconductor defect centers, polymer yellowing, backsheet microcracks, busbar oxidation, cell microcracking. |
| Reversibility | Fully Reversible. Output fully recovers after rainfall, surface washing, or when evening temperatures drop. | Often permanent, but mechanism-dependent. While material degradation (such as encapsulant browning, backsheet cracking, and metallization corrosion) is irreversible, certain electrical mechanisms (such as polarization-mode PID or meta-stable defect states) can exhibit partial reversibility under specific conditions. |
| Time Scale | Minutes to weeks. Fluctuates hourly and seasonally with weather conditions. | Annual degradation rates vary by module technology, manufacturing quality, age, and operating environment. Historical global research reports a median rate around 0.5% per year, while some Indian field surveys of older module installations have reported higher rates. Manufacturer warranty limits should not be treated as measured field degradation rates. |
| Diagnostic Indicator | Sudden generation drop that disappears immediately after an array water washdown. | Consistent year-over-year decline in peak midday clear-sky kilowatt output at equivalent irradiance and cell temperature. |
2. Why Do Solar Panels Lose Efficiency?
A photovoltaic module is an engineered multi-layer laminate designed to seal fragile crystalline silicon wafers—measuring less than 170 micrometers thick—against decades of environmental exposure:
- Tempered Low-Iron Front Glass: Provides impact resistance and high optical transmission.
- Front Encapsulant (EVA or POE): Thermoplastic film providing optical coupling and shock absorption.
- Crystalline Silicon Solar Cells: Interconnected by metallic silver ribbon busbars.
- Rear Encapsulant (EVA or POE): Bonds and electrically insulates the solar cells and interconnections while helping protect them from environmental exposure.
- Rear Cover (Polymer Backsheet or Rear Glass): Provides electrical insulation and environmental protection. In glass-glass modules, a second glass sheet replaces the polymer backsheet.
- Anodized Aluminum Frame & Junction Box: Provides structural mounting rigidity and houses bypass diodes.
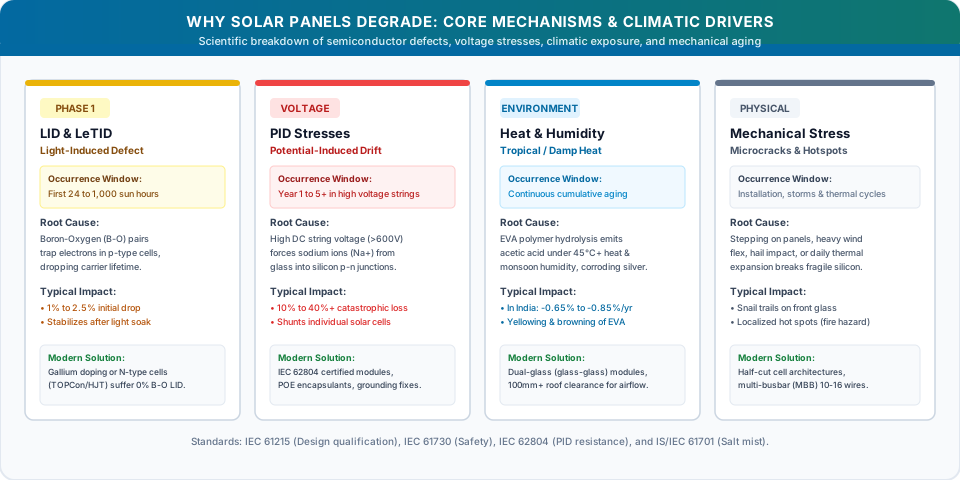
Efficiency loss occurs as environmental stressors gradually break down these internal layers:
A. Optical Degradation and Polymer Yellowing
Under prolonged exposure to short-wavelength ultraviolet radiation (UV-A and UV-B), standard Ethylene Vinyl Acetate (EVA) encapsulant films undergo photochemical decomposition. This reaction produces yellowing or amber chromophores. As the encapsulant loses optical clarity, less sunlight penetrates through to the silicon wafer, causing a direct reduction in short-circuit current (Isc).
B. Metallurgical Corrosion and Series Resistance
Solar cells extract generated current through ultra-thin screen-printed silver contact fingers. Over years of thermal cycling and atmospheric moisture diffusion, trace acetic acid (produced by EVA breakdown) and water vapor can corrode the silver-silicon interface and copper interconnection ribbons. This oxidation raises the module's internal series resistance (Rs), causing generated power to dissipate internally as heat.
C. Mechanical Cell Microcracks
Because crystalline silicon is brittle, modules experience mechanical stresses during transport, rough installation handling, foot traffic during maintenance, and dynamic wind loading. These stresses produce microcracks invisible to the unaided eye. While initially harmless, daily thermal expansion and mechanical flexing can cause microcracks to propagate across the wafer, electrically isolating entire cell segments and creating localized resistance hot spots.
3. Annual Solar Panel Degradation Rates: Global Benchmarks vs. Indian Field Studies
How fast do solar panels degrade in the field? Rather than relying on marketing claims, engineers refer to comprehensive multi-year empirical studies.
The Historical Global Baseline: NREL Durability Meta-Analysis
In the landmark meta-study Photovoltaic Degradation Rates — An Analytical Review (DOI: 10.1002/pip.1182) conducted by Jordan and Kurtz at the National Renewable Energy Laboratory (NREL), researchers analyzed nearly 2,000 degradation rate observations compiled from worldwide field-testing literature spanning roughly 40 years:
- Across this broad historical dataset, the study documented a median degradation rate of 0.5% per year (with an overall mean/average of ~0.8%/year due to a tail of older or heavily degraded historical installations).
- Important Historical Context: This 0.5%/year figure represents a historical research benchmark reflecting field data across multiple generations of flat-plate terrestrial modules; it should be understood as an empirical multi-decadal reference rather than a universal guarantee for every contemporary module model. Recent meta-analyses—notably the 2025 review Determinants of the long-term degradation rate of photovoltaic modules: A meta-analysis (DOI: 10.1016/j.rser.2025.115697) synthesizing 80 primary studies and 610 observations in Renewable and Sustainable Energy Reviews—report an aggregated median degradation rate of 0.94%/year across diverse historical datasets and climate zones, illustrating that measured field degradation varies significantly with cell technology, mounting layout, climate, and evaluation methodology.
Empirical Field Studies in India: The All-India Reliability Surveys
Field performance in tropical, high-temperature, and high-humidity environments differs markedly from temperate regions. Between 2014 and 2018, the National Centre for Photovoltaic Research and Education (NCPRE) at IIT Bombay, in collaboration with the National Institute of Solar Energy (NISE / MNRE), conducted comprehensive field surveys across operational solar plants throughout India, available via the NISE Portal:
- In the All-India Survey of Photovoltaic Module Degradation 2014 inspecting over 1,000 fielded modules across 51 sites—detailed in the peer-reviewed research Comprehensive study of performance degradation of field-mounted photovoltaic modules in India (DOI: 10.1002/ese3.150)—crystalline silicon modules categorized as reasonably performing (Group X) exhibited an average annual degradation rate of approximately 1.33% per year, with substantially higher degradation observed in Hot & Dry and Warm & Humid climatic zones compared to Moderate or Cold regions.
- Subsequent surveys (2016 and 2018)—such as the analysis published in the IEEE Journal of Photovoltaics (DOI: 10.1109/JPHOTOV.2019.2954777)—analyzed larger statistical samples across utility-scale and rooftop arrays, demonstrating that module vintage, manufacturing bill-of-materials (e.g., backsheet and encapsulant formulations), operating temperatures, and Potential-Induced Degradation (PID) are key determinants of field longevity in India.
Degradation rates reported in field surveys reflect specific historical module batches, varying maintenance practices, and local microclimates. Newer Tier-1 modules manufactured with modern anti-PID glass, Gallium doping, and POE encapsulants exhibit substantially improved durability compared to older installations surveyed a decade ago.
Commercial Warranty Terms Across Module Technologies
Commercial module performance warranties define legal contractual thresholds rather than measured empirical field degradation. Performance warranty terms vary significantly by manufacturer, module series, cell technology, and product construction. Some products offer 25-year coverage, while selected product lines provide 30-year or longer performance warranties. Buyers should compare the first-year allowance, subsequent annual reduction, final-year guaranteed power, measurement procedure, and claim conditions in the exact model's warranty document.
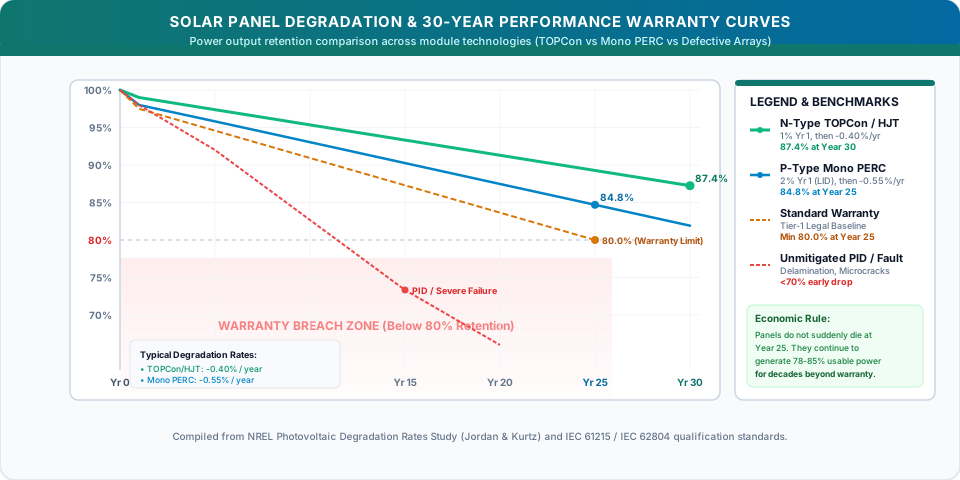
- Documented Manufacturer Example (Waaree Energies): In the official Waaree N-Type TOPCon Elite Series Limited Warranty Statement, Year 1 degradation is warranted not to exceed 1.0%, followed by a linear annual reduction of 0.40 percentage points per year from Years 2 to 30, legally guaranteeing at least 87.4% nominal power output retention at Year 30.
- Standard Market Formats: Many conventional P-Type Mono PERC modules have historically been offered under 25-year performance warranties (often structured with an initial ~2.0% first-year drop and ~0.55%/year subsequent annual step-down, targeting ~84.8% at Year 25), while older polycrystalline modules commonly utilized an 80% 25-year baseline. However, these figures are illustrative market conventions, and contractual terms vary by specific model and manufacturer.
A performance warranty is an insurance boundary setting the threshold for manufacturer RMA claims, not a forecast of actual degradation. Real-world degradation may proceed at slower or faster rates depending on localized heat, UV exposure, humidity, and maintenance quality.
Mathematical Planning Formula: Output Capacity Over Time
To calculate the estimated nameplate DC power capacity (Pt) of a solar module in operating year t, solar designers use a two-stage compound model:
Where:
- Pt = Estimated DC nameplate capacity at Year t under STC (in Watts or kW)
- P0 = Initial factory nameplate capacity at commissioning (in Watts or kW)
- D1 = Initial Year 1 degradation fraction (e.g., 0.02 for 2.0% or 0.01 for 1.0%)
- d = Subsequent annual compound degradation fraction (e.g., 0.0055 for 0.55% per year)
- t = Operating year of evaluation (t ≥ 1)
Pt represents nameplate DC power rating under laboratory STC conditions, not actual kilowatt-hours delivered at the meter. Real-world AC energy generation (kWh) depends on local solar irradiance, ambient and cell temperatures, inverter efficiency, clipping, dirt accumulation, and seasonal weather variability. This formula serves as a simplified deterministic planning model, not a meteorological forecast.
Compound Planning Model vs. Linear Warranty Curves: Note that this formula represents a compound annual degradation model commonly used in engineering simulation tools. In commercial contracts, manufacturer performance warranties are structured as linear percentage-point step-downs relative to nominal rating. For example, in Waaree's official N-Type TOPCon warranty, Year 1 permits a maximum 1.0% drop (minimum 99.0% retention), followed by a linear reduction of exactly 0.40 percentage points per year from Years 2 to 30, guaranteeing at least 87.4% output retention at Year 30 (100% − 1.0% − [29 × 0.40%] = 87.4%).
Worked Calculation: 5 kW Residential Rooftop System
Consider an illustrative 5 kW (5,000 W DC) residential rooftop array installed with standard P-Type Mono PERC modules, assuming an initial Year 1 drop of 2.0% and an annual compound rate of 0.55% thereafter:
Year 10 DC Capacity: P10 = 4,900 × (1 − 0.0055)9 = 4,900 × (0.9945)9 = 4,663 W (4.66 kW)
Year 25 DC Capacity: P25 = 4,900 × (1 − 0.0055)24 = 4,900 × (0.9945)24 = 4,293 W (4.29 kW)
Illustrative AC Energy Impact:
- Assuming an average resource of 4.5 peak sun hours per day and a system Performance Ratio (PR) of 80% (factoring in the degraded DC capacity in each respective year):
- In Year 1 (4.90 kW capacity): the array generates approximately 6,439 kWh per year (monthly average ~537 kWh/month).
- In Year 10 (4.66 kW capacity): generation declines to approximately 6,128 kWh per year (monthly average ~511 kWh/month).
- In Year 25 (4.29 kW capacity): generation declines to approximately 5,641 kWh per year (monthly average ~470 kWh/month).
- At the end of Year 25, the array retains approximately 85.9% of its initial DC nameplate capacity, generating clean, debt-free electricity decades after initial capital payback has been achieved.
4. LID (Light-Induced Degradation) & LeTID Explained
When reviewing initial monitoring logs, homeowners often notice a modest performance decline of 1% to 2% during the first few weeks of operation. This initial drop is typically caused by light-activated semiconductor mechanisms.
The Boron-Oxygen Defect in P-Type Silicon
For decades, mainstream crystalline silicon wafers were P-Type, created by doping molten silicon with Boron. During high-temperature Czochralski ingot growth, trace interstitial oxygen from quartz crucibles inevitably enters the silicon crystal.
When the newly installed panel is exposed to sunlight:
- Solar photons inject free charge carriers (electrons and holes) into the wafer.
- These excess carriers enable mobile oxygen atoms to pair with boron dopants, forming metastable Boron-Oxygen (B-O) defect complexes.
- These complexes act as carrier recombination centers, shortening minority carrier lifetime and reducing cell efficiency by 1% to 2.5%.
- Once all active boron and oxygen pairs form (typically within the first few hundred hours of light exposure), traditional B-O LID stabilizes and ceases to cause further loss.
LeTID: Light and Elevated Temperature Induced Degradation
In passivated cell architectures like Mono PERC, an additional mechanism known as LeTID can emerge. LeTID is activated when illuminated cells operate at sustained high temperatures (50°C to 75°C), involving hydrogen redistribution from dielectric passivation layers into the silicon bulk. In hot climates, LeTID can cause an additional 2% to 5% power reduction over the first 1 to 3 years before partially recovering over time.
How Cell Technology Affects LID
- Gallium-Doped P-Type Silicon: Leading Tier-1 manufacturers largely replaced boron with Gallium in modern P-type PERC modules. Because gallium does not form complexes with oxygen, B-O LID is largely prevented.
- N-Type Silicon (TOPCon & HJT): N-type silicon uses Phosphorus as the primary dopant. Because phosphorus atoms do not bond with oxygen, N-type wafers do not suffer from traditional Boron-Oxygen LID.
- Important Nuance: While N-type modules eliminate Boron-Oxygen LID, they are not unconditionally immune to all light- or temperature-activated degradation. Under specific high-temperature and intense ultraviolet stress, N-type cells can experience surface passivation degradation or UV-induced degradation (UVID). High-quality manufacturers mitigate these secondary mechanisms through specialized passivating contact stacks and UV-stabilized encapsulants.
5. Potential-Induced Degradation (PID) Explained
While LID is a predictable semiconductor phenomenon that stabilizes early, Potential-Induced Degradation (PID) is a voltage-driven wear mechanism that can cause severe, progressive power loss (10% to 40%+) if left unaddressed.
How PID Occurs in High-Voltage PV Arrays
In a PV string, each module operates at an electrical potential determined by its position in the string and the system's grounding arrangement. The voltage difference between the cells and the grounded module frame can create leakage currents through the encapsulant. The magnitude and polarity of this potential vary across the string and depend on inverter topology, system voltage, module position, and earthing design. These conditions can trigger different forms of Potential-Induced Degradation (PID).
Crucially, PID encompasses multiple distinct physical and electrochemical degradation modes depending on cell architecture, voltage polarity, encapsulant formulation, and system earthing:
- PID-s (Shunting PID): The most common form in standard p-type crystalline silicon modules operating under high negative potential relative to ground. High electric fields force mobile positively charged sodium ions (Na+) from soda-lime front glass through the encapsulant into the cell's antireflective coating (SiNx) and p-n junction. Accumulated sodium ions form microscopic shunt paths, collapsing the cell's shunt resistance (Rsh) and open-circuit voltage (Voc), leading to severe power loss.
- PID-p (Polarization): Charge accumulation in dielectric passivation layers can increase surface recombination and reduce cell voltage and current. It has been reported in different cell architectures, with susceptibility depending on cell structure, voltage polarity, and module construction. It may be partially reversible under suitable conditions.
- PID-c (Corrosion): Electrical stress and moisture can promote electrochemical reactions involving cell metallization, conductive layers, dielectric materials, or other module components. The affected materials and resulting power loss depend on the module construction and the specific corrosion pathway.
Because PID vulnerability depends heavily on cell design, encapsulant resistivity, and system grounding, PID cannot be addressed with a single assumption. Rigorous qualification requires testing under standardized protocols such as IEC TS 62804-1.
Mitigating PID: Practical Engineering Realities
| Design Factor | Risk Elements | Effective Engineering Countermeasures |
|---|---|---|
| Module Selection | Standard glass with permeable EVA in high-voltage strings. | Insist on modules tested and certified under **IEC TS 62804-1** (PID resistance standard). |
| Encapsulant Material | Standard EVA film has lower volume resistivity and allows moisture/ion diffusion. | **Polyolefin Elastomer (POE)** or EPE co-extruded encapsulants typically offer higher electrical resistivity and lower moisture permeability than conventional EVA formulations. |
| Module Construction | Single-glass polymer backsheets allow water vapor ingress, increasing leakage currents. | **Dual-glass (glass-glass) modules** provide superior moisture protection, substantially reducing PID risk (though proper cell-level anti-PID passivation remains essential). |
| Inverter Architecture | High-voltage DC string inverters (>600V) operating in hot and humid microclimates. | **Microinverters** operate at lower module-level DC voltages rather than long high-voltage strings, reducing the voltage bias driving ion migration. However, microinverters are not a universal substitute for verified module-level PID resistance. Specialized anti-PID offset boxes can also reverse potential at night in select central or string plants. |
6. Effect of Heat, Humidity, and Environmental Exposure (Tropical Climate Context)
Standard laboratory tests (STC) assess panels at a mild cell temperature of 25°C (77°F). However, rooftop solar modules in tropical and sub-tropical regions—such as Northern, Western, and Southern India—routinely face severe environmental stress:
- Ambient summer temperatures in states like Rajasthan and Gujarat reach 42°C to 47°C.
- Because dark silicon absorbs solar radiation, operating cell junction temperatures reach 65°C to 75°C.
- Subsequent monsoon seasons subject modules to relative humidity exceeding 80% to 90% for weeks at a time.
1. Thermal Derating and Thermal Cycling Stress
Solar cells produce less power as they heat up, governed by the module's Temperature Coefficient of Maximum Power (γPmax):
- Standard P-Type Mono PERC: γPmax ≈ −0.35%/°C to −0.38%/°C
- Modern N-Type TOPCon: γPmax ≈ −0.30%/°C
- N-Type Heterojunction (HJT): γPmax ≈ −0.26%/°C
When cell temperature reaches 70°C on a hot summer afternoon (45°C above the 25°C STC baseline), instantaneous power loss is substantial:
While this daily thermal loss is temporary (power fully recovers as modules cool down in the evening), thousands of thermal expansion cycles over decades cause cumulative physical wear:
- Solder joints connecting copper ribbons to silver contacts experience shear stress due to differing thermal expansion rates.
- Convective roof ventilation helps moderate operating temperatures: elevating modules 100mm to 150mm above the roof deck facilitates airflow beneath the array, though the exact temperature reduction depends on roof pitch, wind conditions, and mounting geometry.
2. Damp Heat and EVA Hydrolysis
Under IEC 61215 qualification standards, modules undergo a "Damp Heat" test (1,000 hours at 85°C and 85% relative humidity). In tropical field conditions, moisture diffusing through permeable polymer backsheets can react with EVA under heat and UV radiation:
Trapped acetic acid corrodes internal silver contacts and copper ribbons, increasing series resistance and degrading the module's Fill Factor (FF). Dual-glass modules and POE encapsulants significantly reduce this risk by restricting moisture diffusion.
3. Coastal Salt Mist Exposure
For installations within 5 to 10 km of coastal shorelines (e.g., Mumbai, Chennai, Kochi, Surat), airborne salt crystals deposit on module surfaces. In humid conditions, salt mist forms an electrolytic film that accelerates galvanic frame corrosion and increases surface leakage currents. Coastal installations should use PV modules tested to an IEC 61701 severity level appropriate to the site's actual salt-mist exposure. The required test severity should be selected based on local environmental conditions rather than assuming Level 6 is necessary for every coastal project.
4. Thermal Shock Caution During Cleaning
As a prudent operational practice recommended in module manufacturer manuals, avoid washing hot solar panels with cold tap water during peak afternoon sunshine. Pouring cold water onto panels operating at high summer temperatures introduces localized thermal stress gradients across the glass and module encapsulation. Array cleaning should be scheduled during early morning hours or post-sunset when panels are cool.
7. How Long Do Solar Panels Actually Last? (Historical Field Evidence)
A persistent question among solar buyers is whether panels abruptly stop functioning once their warranty expires.
Solar panels do not suddenly fail at Year 25.
Because photovoltaic modules are solid-state devices with no moving parts or circulating fluids, undamaged panels continue generating usable electricity for 30, 40, or more years, albeit at gradually reduced efficiency.
Historic Long-Term Durability Studies
Empirical research on early photovoltaic installations provides compelling proof of long-term durability:
- TISO-10 (Switzerland): Europe's first grid-connected photovoltaic installation, the 10 kW TISO-10 system, was commissioned in 1982 at the University of Applied Sciences and Arts of Southern Switzerland (SUPSI) in Lugano. In a comprehensive 35-year study published in Progress in Photovoltaics (DOI: 10.1002/pip.3146), researchers demonstrated that after 35 years of outdoor exposure, the majority of original crystalline silicon modules continued to generate over 80% of their initial rated power, with median annual degradation rates ranging between 0.2% and 0.7% per year.
- University of Oldenburg (Germany): Long-term testing on modules installed in the early 1980s at the Oldenburg Energy Lab has similarly documented that well-encapsulated crystalline silicon modules maintain stable electrical generation over multi-decade lifecycles.
Physical Lifespan vs. Economic Lifespan
While panels may physically generate power for 35 to 45 years, their economic lifespan is typically evaluated between 25 and 30 years:
- Contemporary commercial module efficiencies range between 20.5% and 22.8% for mainstream TOPCon and Mono PERC, with premium back-contact and HJT modules reaching 23% to 24%+.
- When older panels from the 1990s or 2000s (with efficiencies of 12% to 15%) reach 25–30 years of age, homeowners often choose to "repower" their roof—not because the old panels are broken, but because modern panels can produce more electricity from the exact same roof space.
- Financial payback periods vary significantly based on local utility tariffs, government subsidies (such as India's PM Surya Ghar scheme), net metering rules, and household self-consumption rates. While simple payback is often achieved within several years of operation, ongoing maintenance, periodic cleaning, and eventual inverter replacement costs may still apply over the system's operational life.
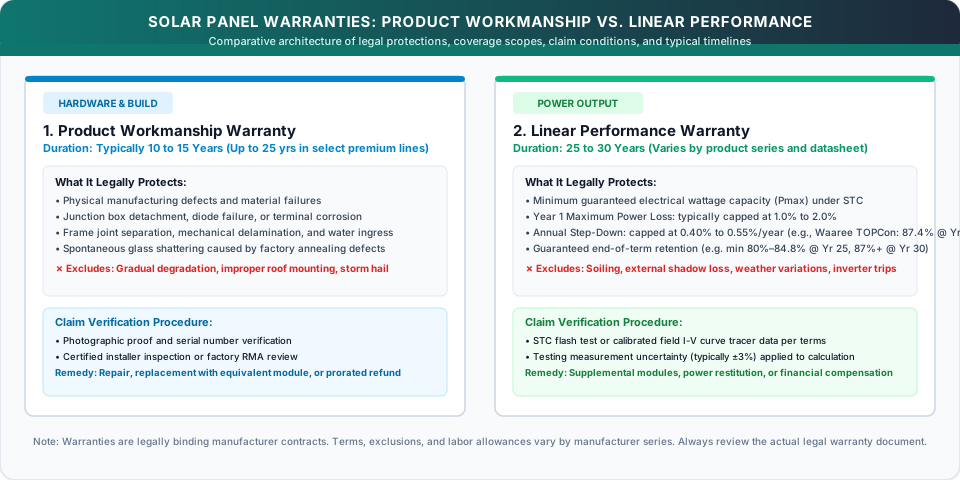
8. Solar Panel Product Warranty vs. Performance Warranty
Solar module specification sheets list two separate, distinct warranties. Understanding the difference is vital for evaluating installer quotations:
1. Product Workmanship Warranty (10 to 15 Years)
- Scope: Covers manufacturing defects, material flaws, frame separation, junction box failures, bypass diode breakdown, and mechanical delamination.
- Duration: Typically 10 to 15 years for mainstream Tier-1 modules, though select premium manufacturers offer 25-year product warranties.
- Remedy: Repair, replacement of the defective module, or a prorated refund if a physical manufacturing flaw arises.
2. Linear Performance Warranty (25 to 30 Years)
- Scope: Guarantees that electrical power output will not degrade faster than a specified annual percentage under STC conditions.
- Documented Manufacturer Example:
- Waaree N-Type TOPCon Elite Series: The official Waaree N-Type TOPCon Elite Series Limited Warranty Statement warrants initial Year 1 degradation ≤ 1.0%, followed by a linear annual degradation ≤ 0.40%/year from Years 2 to 30, legally guaranteeing at least 87.4% power retention at Year 30.
- Important Note: Performance warranty terms vary significantly by manufacturer, module series, and technology. Some products offer 25-year terms, while select dual-glass product lines provide 30-year or longer warranties. Always review the exact model's legal warranty document for specific first-year allowances, annual derating steps, and claim procedures before purchasing.
Understanding Industry Ratings and Warranty Practicalities
- The BNEF Tier-1 Rating Explained: Installers often market modules as "Tier-1." It is important to understand that the BloombergNEF (BNEF) Tier-1 classification is a financial bankability metric, determined by whether commercial banks have provided non-recourse financing to projects using that brand. It is not an independent technical inspection, quality certification, or durability test.
- Warranty Claim Requirements: In the event of an output dispute, warranty claim procedures depend on the manufacturer's terms. While some manufacturers may request independent laboratory flash-test reports under STC, many Tier-1 brands accept calibrated field I-V curve tracer data, irradiance-normalized string logs, or inspection reports from certified installers.
9. How to Identify Solar Panel Performance Loss: Safe Diagnostic Steps
If your electricity bill increases or generation monitoring shows lower unit production, follow these safe, systematic troubleshooting steps:
Never attempt to touch live DC wiring, disconnect MC4 connectors under load, or probe high-voltage DC circuits with household multimeters. Residential solar strings operate at lethal direct-current voltages (400V to 600V+ DC) that present severe electrical arc and shock hazards. Rooftop inspection of live electrical components must strictly be performed by certified, licensed solar technicians using appropriate personal protective equipment (PPE).
Step 1: Visual Inspection (From Ground or Safe Perimeter)
Look across the array during early morning or late afternoon for visible signs of material distress:
- Encapsulant Browning: Yellow or amber discoloration over active cell areas.
- Snail Trails: Dark, zigzagging lines on the front glass indicating localized silver grid line oxidation over microcracks.
- Delamination: Milky, hazy, or bubbled patches where polymer layers have separated from the glass or cells.
- Hot Spot Burn Marks: Dark or scorched circular marks visible on the backsheet behind individual cells.
Step 2: Module-Level Monitoring Comparison
If your system utilizes microinverters or DC optimizers, compare individual module production curves on clear-sky days:
- If all panels exhibit proportional generation reductions during hot summer afternoons, the array is simply experiencing normal ambient temperature derating.
- If one isolated panel consistently produces 20% to 50% less energy than identical adjacent panels under zero shade, that module has a localized issue (such as a triggered bypass diode, cracked wafer, or connection fault).
Step 3: Specific Yield Analysis (kWh/kWp)
Compare your monthly generation against the same month across consecutive years using normalized Specific Yield:
Specific yield normalizes energy generation by installed capacity, but it does not independently correct for differences in solar irradiance, shading, or weather conditions. For a reliable degradation assessment, compare performance under equivalent irradiance and temperature conditions or use suitable weather-normalized monitoring data.
Step 4: Professional Thermal Imaging (Infrared Thermography)
When abnormal generation is suspected, an authorized technician can inspect the energized array using an infrared (FLIR) camera:
- Healthy cells appear uniformly cool.
- Severely degraded cells or cracked wafers appear as localized hot spots, running abnormally hotter than surrounding cells due to localized electrical resistance dissipation.
10. When Should You Replace Solar Panels?
Because solar modules age gradually rather than failing instantaneously, replacing them is primarily an economic and spatial decision:
| Operational Scenario | Array Age | Performance Status | Recommended Course of Action |
|---|---|---|---|
| Normal Healthy Aging | 10 – 20 Years | Retaining 85% – 92% of nameplate rating with clean, uncracked surfaces. | Do Not Replace. The system may continue generating low-cost electricity well beyond its initial payback period, although maintenance, cleaning, inverter replacement, and other operating expenses may still apply. Replacement would add unnecessary capital expense without improving net ROI. |
| Single Module Failure | 5 – 15 Years | One panel has shattered glass or a burnt junction box; remaining panels operate normally. | Replace Only the Damaged Module. Install an electrically compatible replacement module (matching current Imp and voltage ratings) rather than decommissioning the entire array. |
| Suspected PID / Premature Power Loss | 3 – 8 Years | Array output has dropped significantly (e.g., 20% to 40%) accompanied by abnormal string voltage drops or visible backsheet distress. | Commission Professional Diagnostics & Review Warranty Terms. Arrange on-site diagnostic testing (such as string I-V curve tracing, insulation resistance, and thermal imaging) by certified technicians to document whether the loss is caused by warrantable Potential-Induced Degradation or external site factors. If diagnostic logs confirm performance below the guaranteed linear threshold, submit a claim in accordance with the manufacturer's specific warranty terms and RMA procedures. |
| Roof Space Constraint & Load Growth | 15 – 25 Years | Older 200W–250W panels occupy the entire roof, but household electricity consumption has doubled due to electric vehicles (EVs) and heat pumps. | Repowering Assessment. Replacing low-efficiency older modules with modern high-efficiency TOPCon or bifacial panels may substantially increase capacity, depending on available roof area and module dimensions. |
Practical Guidelines to Minimize Solar Degradation
- Follow Manufacturer Mounting & Ventilation Guidelines: Design mounting elevation and tilt according to the module manufacturer's installation manual and structural racking specifications. On flat concrete or metal deck roofs, providing adequate convective clearance (often recommended around 100mm to 150mm where site layout permits) facilitates passive airflow to moderate operating temperatures; pitched tile or standing-seam roofs should follow system-specific standoff engineering.
- Select Certified N-Type Dual-Glass Modules: For new installations in hot and humid climates, dual-glass TOPCon or HJT modules with POE encapsulants provide superior resistance to moisture ingress, PID, and chemical degradation.
- Never Step or Rest Ladders on Panels: Never allow cleaning or maintenance personnel to walk or kneel on solar modules. Wafer flexure produces microscopic silicon microcracks that develop into performance-robbing hot spots over time.
- Clean Early Morning or After Sunset: Avoid spraying cold water onto hot solar glass during peak midday sunlight to prevent thermal shock stress.
- Comply with Applicable Electrical & Earthing Codes: Ensure system earthing, equipment grounding, and surge protection are designed and executed in accordance with applicable national electrical codes (such as IS 3043 and Central Electricity Authority regulations in India, or IEEE 142 / NEC Article 690 internationally) and the inverter manufacturer's earthing instructions to ensure personal safety and manage stray frame potentials.
Official Research Sources & References
- National Renewable Energy Laboratory (NREL / U.S. DOE): Photovoltaic Degradation Rates — An Analytical Review (DOI: 10.1002/pip.1182) — Multi-decade analytical review of global module degradation benchmarks (Jordan & Kurtz) published in Progress in Photovoltaics.
- Renewable and Sustainable Energy Reviews (Elsevier): Determinants of the long-term degradation rate of photovoltaic modules: A meta-analysis (DOI: 10.1016/j.rser.2025.115697) — Meta-analysis by Straub-Mück et al. (2025) synthesizing 80 global field studies and 610 degradation rate observations, evaluating key determinants of long-term module durability.
- National Institute of Solar Energy (NISE) & MNRE: NISE Official Portal — Official archive hosting the All-India Survey of Photovoltaic Module Degradation / Reliability reports (2013, 2014, 2016, 2018).
- Energy Science & Engineering (Wiley): Comprehensive study of performance degradation of field-mounted photovoltaic modules in India (DOI: 10.1002/ese3.150) — Peer-reviewed analysis of 1,000+ operational modules from the 2014 All-India Survey documenting 1.33%/year degradation across climatic zones.
- National Centre for Photovoltaic Research and Education (NCPRE, IIT Bombay): NCPRE Research Portal, IIT Bombay & IEEE Journal of Photovoltaics: Analysis of Field Degradation Rates Observed in All-India Survey (DOI: 10.1109/JPHOTOV.2019.2954777) — Empirical field surveys of module degradation across Indian climatic zones.
- Ministry of New and Renewable Energy (MNRE), Government of India: mnre.gov.in — National solar quality guidelines, ALMM standards, and reliability program reports.
- Waaree Energies: Waaree N-Type TOPCon Elite Series Limited Warranty Statement — Official manufacturer product and linear performance warranty terms for TOPCon bifacial modules.
- Wiley Progress in Photovoltaics: TISO-10: 35 Years of Photovoltaics (DOI: 10.1002/pip.3146) — Empirical 35-year operational evaluation of Europe's first grid-connected PV plant in Lugano, Switzerland.
- National Laboratory of the Rockies (NLR, formerly NREL): NLR Solar Research Portal — Official research hub for PV cell durability, service life prediction, and reliability testing.
- U.S. Department of Energy (DOE): Solar Photovoltaic Technology Basics (SETO) — Federal guidance on PV operating principles, balance-of-system mechanics, and real-world performance factors.
- International Electrotechnical Commission (IEC): iec.ch — Standards IEC 61215 (Design Qualification & Type Approval), IEC 61730 (Safety Qualification), IEC TS 62804-1 (PID Resistance), and IEC 61701 (Salt Mist Corrosion).