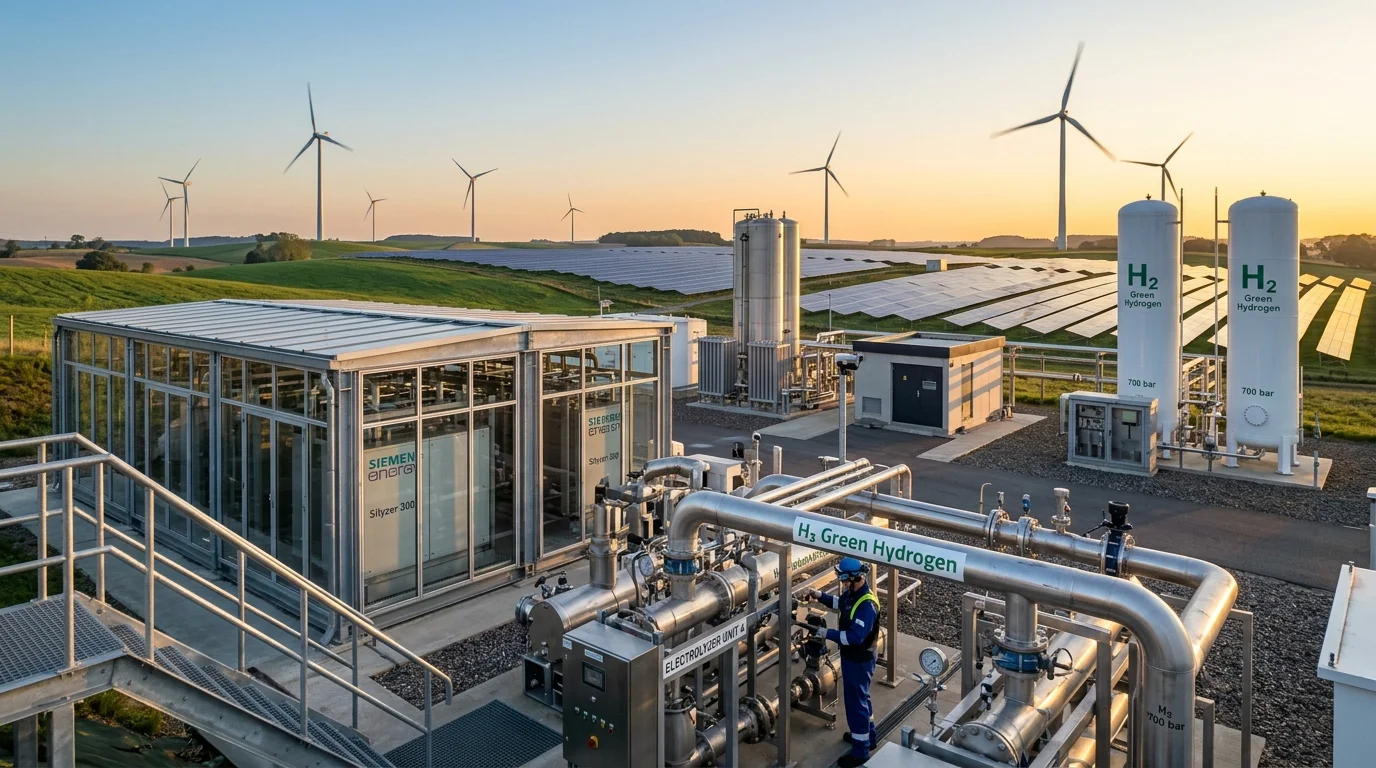
Hydrogen is the most abundant chemical element in the universe, making up roughly 75% of the mass of ordinary matter. In everyday terms, hydrogen is a clean, versatile gas that carries immense energy. In a hydrogen fuel cell, hydrogen reacts electrochemically with oxygen to produce electricity, water, and heat, without direct CO₂ emissions from the reaction.
On Earth, hydrogen is not naturally available in large, usable quantities as free molecular hydrogen (H₂). Instead, it is mainly found chemically bonded in compounds such as water (H₂O) and hydrocarbons such as natural gas (CH₄). Producing usable hydrogen therefore requires an energy-intensive separation process. Global hydrogen production remains overwhelmingly dependent on fossil fuels—a process that releases hundreds of millions of metric tons of greenhouse gases each year.
Green hydrogen fundamentally transforms this process. By using zero-carbon renewable electricity (from solar, wind, and hydro) to split ordinary water into hydrogen and oxygen through water electrolysis, we can manufacture clean hydrogen with near-zero operational emissions. While electric batteries and rooftop solar are transforming passenger cars and home power, heavy industries—such as steel manufacturing, fertilizer production, cargo shipping, and long-haul transport—require immense heat and chemical energy that batteries cannot easily provide. Green hydrogen provides the missing link for decarbonizing these heavy sectors.
This educational and technical guide explains green hydrogen from the ground up: what it is, how water electrolysis works, how it compares across the hydrogen "colour spectrum", storage and safety logistics, industrial uses in steel and agriculture, fuel cell vehicles versus battery electric vehicles, and the realistic economic hurdles the technology must overcome.
1. What Is Green Hydrogen Energy?
To understand green hydrogen, it is essential to distinguish between a primary energy source and an energy carrier:
- Primary Energy Source: Naturally occurring energy forms that exist in nature without human conversion (such as solar sunlight, kinetic wind, crude petroleum, or geothermal heat).
- Energy Carrier: A medium that stores and moves energy produced by a primary source so it can be released as electricity, heat, or mechanical power at another time or location (like electricity in a power grid or chemical energy in a battery).
Hydrogen is not an energy source that can be drilled or mined directly from the ground. It is an energy carrier. "Green hydrogen" specifically refers to hydrogen gas (H2) produced by splitting water using verified renewable electricity, producing oxygen as its primary byproduct.
Hydrogen vs. Green Hydrogen: The Crucial Distinction
Chemically, molecular hydrogen is identical regardless of how it is produced: an odorless, colorless diatomic gas with the highest gravimetric energy content of any common chemical fuel:
- Lower Heating Value (LHV): approximately 120 MJ/kg (~33.3 kWh/kg)
- Higher Heating Value (HHV): approximately 142 MJ/kg (~39.4 kWh/kg)
The prefix "Green" describes the lifecycle carbon intensity of its production pathway:
- Traditional Hydrogen (Grey/Black): Derived from unabated fossil fuels (natural gas or coal), generating roughly 9 to 12 kilograms of CO2 (and up to 24 kg CO2 for coal) per kilogram of hydrogen produced.
- Green Hydrogen: Manufactured via water electrolysis powered by renewable electricity. While the water-splitting reaction produces zero direct operational greenhouse emissions at the stack, its cradle-to-gate lifecycle footprint is not automatically zero and varies significantly by project configuration. Upstream equipment manufacturing (solar modules, wind turbines, and battery buffers), balance-of-plant power electronics, and potential supply chain leakage determine its true footprint (with peer-reviewed syntheses in Nature Energy finding a median of ~2.9 kg CO2e per kg of H2 under dedicated renewable configurations).
The Bridge to Renewable Energy Integration
As electrical grids integrate higher shares of solar and wind power, clean energy generation fluctuates with weather conditions. During windy nights or sunny mid-days, generation can exceed local grid demand, forcing grid operators to curtail (waste) clean power.
Green hydrogen can support long-duration and seasonal energy storage, particularly where suitable underground geological storage formations (such as bedded or domal salt caverns) and the required transport infrastructure are accessible. Its economic and technical viability depends on local geology, round-trip conversion efficiency, storage capacity, and the intended storage duration.
2. How Is Green Hydrogen Produced? The Science of Water Electrolysis
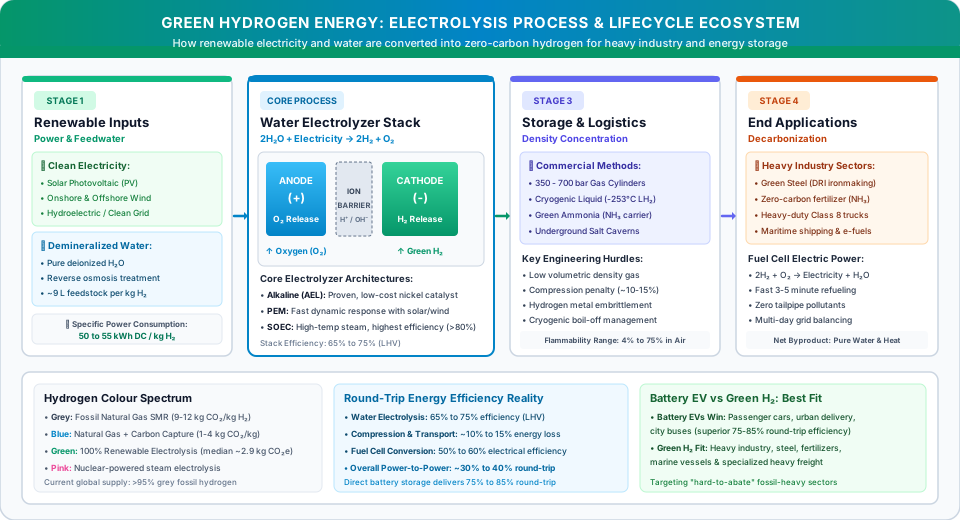
The foundational chemical mechanism behind green hydrogen production is water electrolysis—the electrochemical decomposition of water into hydrogen and oxygen gases using direct electrical current (DC), as documented in technical standards by the U.S. Department of Energy (DOE) and the International Energy Agency (IEA).
The Overall Electrochemical Reaction
At standard temperature and pressure, the splitting of water into its constituent elements is a non-spontaneous, endothermic reaction requiring an input of Gibbs free energy (ΔG° = +237.2 kJ/mol of H2):
Inside an electrolysis cell, two conductive electrodes (an anode and a cathode) are immersed in an electrolyte or separated by an ion-permeable membrane. When a direct-current electrical voltage exceeding the thermodynamic decomposition potential (theoretically 1.23 Volts at 25°C, practically 1.8 to 2.2 Volts due to internal cell overpotentials) is applied across the electrodes:
- At the Anode (+ Positive Electrode): Water molecules or hydroxide ions are oxidized, releasing electrons and generating oxygen gas (O2).
- Through the Separator / Membrane: Positively charged hydrogen ions (protons, H+) or negatively charged hydroxide ions (OH−) migrate through an ion-selective boundary while physically blocking gas crossover to avoid hazardous H2/O2 mixing.
- At the Cathode (− Negative Electrode): Migrated protons accept electrons from the external electrical circuit (reduction), forming purified hydrogen gas (H2).
Major Electrolyzer Technologies Compared
Commercial green hydrogen production utilizes three primary electrolyzer architectures, each distinguished by operating temperature, electrolyte chemistry, and dynamic response:
| Electrolyzer Technology | Operating Temperature & Pressure* *Typical indicative ranges; vary by system design and manufacturer |
Electrolyte / Separator | Indicative System Efficiency (LHV)** | Key Engineering Advantages & Trade-offs |
|---|---|---|---|---|
| Alkaline Electrolysis (AEL) | 60°C to 90°C 1 to 30 bar |
Liquid Potassium Hydroxide (KOH, ~20–30% solution) with porous diaphragm | 60% to 70% (~50–55 kWh/kg stack) |
Mature & Low-Cost: Uses non-precious nickel catalysts; longest operating track record. Its dynamic response depends on system design and operating strategy. Some alkaline systems can operate with variable renewable electricity, although their ramping characteristics and operating constraints may differ from PEM systems; requires lye handling. |
| Proton Exchange Membrane (PEM) | 50°C to 80°C 20 to 50 bar |
Solid sulfonated fluoropolymer membrane (e.g., Nafion) | 65% to 75% (~45–52 kWh/kg stack) |
Fast Dynamic Cycling: Ramps up/down in seconds to track intermittent solar and wind variations; produces high-pressure, ultra-pure H2. However, relies on expensive, scarce catalysts (platinum cathode, iridium anode) and titanium bipolar plates. |
| Solid Oxide Electrolyzer Cell (SOEC) | 650°C to 850°C 1 to 15 bar |
Solid ceramic yttria-stabilized zirconia (YSZ) | 80% to 90%+ (~38–45 kWh/kg electrical, with external heat) |
Highest Thermodynamic Efficiency: Operates on high-temperature steam rather than liquid water. The 80% to 90%+ efficiency figure specifically incorporates the contribution of high-temperature external steam or industrial waste heat, which substitutes for a portion of the electrical energy input; it is therefore not directly comparable on an electricity-only basis to low-temperature electrolysis. Without external waste heat, overall electricity consumption is comparable to PEM. High ceramic degradation and prolonged startup times currently constrain commercial scale. |
**Note on Efficiency: Efficiency figures are indicative Lower Heating Value (LHV) metrics based on the IEA Technology Report on Electrolysers and the U.S. DOE Hydrogen Production Guidelines. Note that SOEC efficiency accounts for high-temperature thermal heat input rather than electricity alone. Actual operational efficiency varies significantly based on system boundary definitions (stack-only DC versus full facility AC-to-DC rectification and balance-of-plant compression), operating load, degradation over time, and ambient temperature.
Practical Step-by-Step Production Workflow
To illustrate how green hydrogen is produced in a utility-scale installation:
- Power Generation & Inversion: A utility-scale solar photovoltaic array or wind farm generates renewable alternating or direct current. Dedicated industrial rectifiers convert high-voltage AC into smooth, low-voltage, high-amperage direct current (DC) calibrated to the electrolyzer stack's operating curve.
- Feedwater Deionization: Municipal or desalinated water undergoes multi-stage purification (such as reverse osmosis followed by electro-deionization). Electrolyzers require carefully treated, high-purity water to prevent electrode poisoning, catalyst deactivation, and membrane scaling; the exact conductivity and impurity thresholds depend on the specific electrolyzer technology and manufacturer specifications.
- Electrochemical Splitting: The purified water is pumped into the electrolyzer stack, where direct current splits the molecules into H2 at the cathode and O2 at the anode.
- Gas-Liquid Separation, Drying & Purification: The raw wet hydrogen stream passes through gas-liquid separators and desiccant drying towers. For vehicle applications, dedicated de-oxygenation and pressure swing adsorption (PSA) polishing units ensure that final dispensed fuel complies with ISO 14687 Grade D (the standard specification for fuel cell road vehicles, updated in ISO 14687:2025, which requires a minimum 99.97% hydrogen fuel index with strict limits on catalyst poisons such as carbon monoxide, sulfur, and ammonia).
- Compression & Buffer Storage: Centrifugal or reciprocating compressors elevate the hydrogen pressure from production levels (typically 20–30 bar). Hydrogen may be compressed to 350 or 700 bar for vehicle fuel tanks and certain high-pressure distribution vessels. Pipeline injection and underground salt-cavern storage operate under site-specific pressure regimes and should not be treated as equivalent to vehicle storage pressures.
To produce 1 kilogram of green hydrogen gas (which contains ~33.3 kWh of usable energy, Lower Heating Value):
- Chemical Feedstock Water Requirement: Approximately 9 to 11 Liters of high-purity demineralized water (based on the stoichiometric splitting of H2O).
- Total Facility Water Consumption: Actual water consumption depends on electrolyzer technology, cooling system design, climate, and water-treatment configuration. A recent technical review reported average water consumption of approximately 17.5 liters per kg of hydrogen for PEM electrolysis and 22.3 liters per kg for alkaline electrolysis. Water withdrawal and water consumption are different measures, so project-specific figures should be assessed separately.
- Indicative Electrical Consumption: Approximately 45 to 55 kilowatt-hours (kWh) of direct-current (DC) renewable electricity at the stack level (50 to 65 kWh/kg when including balance-of-plant compressors, pumps, and water treatment), as benchmarked by the U.S. DOE and the Ministry of Power, Government of India.
3. The Hydrogen "Colour Spectrum": Grey, Blue, and Green
The energy industry commonly uses a colour-based terminology to describe hydrogen production pathways and their associated environmental impacts. However, these colour labels are not universally standardized, and formal definitions and certification thresholds vary across regulatory jurisdictions:
| Hydrogen Colour Label | Primary Feedstock & Energy Source | Manufacturing Technology | Carbon Capture Included? | Indicative Lifecycle Carbon Intensity (kg CO2e / kg H2)* *Indicative estimates; lifecycle boundaries and methodologies vary |
|---|---|---|---|---|
| Grey Hydrogen | Fossil Natural Gas (Methane) | Steam Methane Reforming (SMR) | No (CO2 vented directly to atmosphere) | 9.0 – 12.0 (Direct reforming flue gas + upstream gas extraction) |
| Black / Brown Hydrogen | Bituminous Coal or Lignite | Coal Gasification | No | 18.0 – 24.0 (Direct gasification emissions + upstream coal supply chain) |
| Blue Hydrogen | Fossil Natural Gas | SMR or Autothermal Reforming (ATR) + Carbon Capture & Storage (CCS) | Yes (typically captures 60%–85% of SMR flue gas CO2 or 90%+ of ATR syngas CO2 depending on process design) | 1.5 – 4.5 (Heavily dependent on upstream fugitive methane leaks) |
| Green Hydrogen | Water + Renewable Electricity Meeting Applicable Certification Criteria | Water Electrolysis (AEL, PEM, SOEC) | Not required (zero direct operational carbon emitted) | Varies by project configuration (A 2024 Nature Energy synthesis reported a median of approximately 2.9 kg CO2e per kg of H2 for optimistic production configurations using dedicated renewable electricity. Actual lifecycle emissions vary with electricity source, equipment manufacturing, plant utilisation, and system boundaries.) |
| Turquoise Hydrogen | Fossil Natural Gas | Methane Pyrolysis (thermal splitting) | Solid Carbon Black byproduct (no gaseous CO2) | Highly pathway-dependent (Contingent on pyrolysis thermal power source, solid carbon fate, and upstream methane leakage) |
| Pink / Red Hydrogen | Water + Nuclear Energy | High-temperature steam electrolysis or thermochemical cycles | Not required | Highly pathway-dependent (Contingent on nuclear reactor thermal integration and fuel-cycle emissions boundaries) |
Sources & Methodology: Carbon-intensity benchmarks are synthesized from the IEA Global Hydrogen Review, the U.S. Department of Energy (DOE) Clean Hydrogen Production Standard (CHPS), and peer-reviewed lifecycle evaluations in Nature Energy (2024). Levelized production costs are omitted from the table because they vary widely by region, fluctuating local fuel tariffs, and evolving capital costs (for reference, indicative regional production costs for green hydrogen currently range from roughly $3.50 to $6.50/kg depending on local renewable electricity prices and electrolyzer capex). If uncertified grid electricity containing fossil generation is used instead of dedicated renewables, green hydrogen's lifecycle emissions can exceed 15 to 25 kg CO2e/kg H2, completely negating its environmental benefit.
Environmental and Lifecycle Implications
While grey hydrogen is commercially inexpensive today, unabated fossil production is a major greenhouse gas contributor. According to the IEA Global Hydrogen Review 2026, global hydrogen demand surpassed 100 million tonnes (Mt) in 2025. Low-emissions hydrogen production grew by approximately 20% to almost 1 Mt, but remained a very small share (under 1%) of global supply. Installed global electrolysis capacity doubled in 2025, reaching over 4 GW. Hydrogen production worldwide continues to rely overwhelmingly on fossil fuels. For context, in 2023, global hydrogen production generated approximately 920 Mt of CO₂ emissions, according to the IEA. The majority of hydrogen supply continued to come from unabated fossil fuels.
Blue hydrogen attempts to mitigate these emissions by capturing carbon dioxide from reforming gases and sequestering it in deep geological formations. Modern carbon capture and storage (CCS) units achieve varying capture rates depending on facility engineering: conventional steam methane reforming (SMR) with post-combustion flue gas capture typically achieves 60% to 85% capture, whereas modern autothermal reforming (ATR) designs treating high-pressure syngas streams can achieve 90% to more than 95% CO2 capture. However, independent research published by the U.S. Department of Energy (DOE) and the IEA emphasizes that blue hydrogen's overall lifecycle emissions remain heavily dependent on upstream fugitive methane leakage (methane escaping during natural gas extraction and pipeline transit, which possesses a 20-year global warming potential over 80 times that of CO2).
Green hydrogen can significantly reduce lifecycle greenhouse gas emissions when produced using verified renewable electricity, although its total environmental footprint depends on the full supply chain. Importantly, lifecycle emissions are not automatically zero. A comprehensive 2024 synthesis published in Nature Energy evaluated diverse green hydrogen supply configurations and identified a median cradle-to-gate lifecycle carbon intensity of roughly 2.9 kg CO2e per kg of H2 for optimistic production configurations using dedicated wind and solar power. This footprint arises primarily from embodied emissions in manufacturing photovoltaic modules, wind turbines, power electronics, and battery storage buffers; adding long-distance transport (such as 1,000 km of liquid or compressed delivery) can add significant additional lifecycle emissions.
Furthermore, atmospheric chemistry research (including studies published by the UK Department for Energy Security and Net Zero and NOAA) highlights that fugitive molecular hydrogen acts as an indirect greenhouse gas with an estimated 100-year Global Warming Potential (GWP) of approximately 11 ± 5. When hydrogen leaks into the atmosphere, it reacts with and depletes tropospheric hydroxyl radicals (OH), which slows down the natural breakdown of atmospheric methane. Therefore, realizing green hydrogen's full climate benefit requires strict leak-detection protocols and airtight pipeline infrastructure alongside clean electricity.
4. How Is Green Hydrogen Stored and Transported?
A primary technical challenge of hydrogen energy lies in its physical state and density: while hydrogen boasts extraordinary gravimetric energy density (~33.3 kWh/kg LHV, nearly three times that of gasoline or diesel), it possesses an exceptionally low volumetric energy density at ambient pressure as a gas (just ~3.0 kWh per cubic meter, compared to ~9,000 to 10,000 kWh/m3 for conventional hydrocarbons stored as liquids).
To make hydrogen transportable and usable, the global energy sector relies on four primary logistical and storage pathways, ranging from mechanical pressure containment to chemical carrier synthesis:
1. High-Pressure Compressed Gas Storage
Gaseous hydrogen is compressed into heavy-duty vessels:
- 350 bar (5,000 psi): Commonly used for transit buses, heavy-duty trucks, and bulk industrial tube trailers.
- 700 bar (10,000 psi): Standard for passenger fuel cell vehicles (such as the Toyota Mirai) to maximize onboard driving range within compact vehicle footprints.
- Type IV Composite Cylinders: Modern hydrogen tanks feature seamless, carbon-fiber-wrapped polymeric liners designed to withstand extreme pressure cycling, impact, and internal permeation without adding excessive vehicle weight.
- Underground Geological Storage: For massive, gigawatt-hour utility storage, underground geological storage represents a potential solution, but it is geographically constrained and not a universal option. While bedded or domal salt caverns represent the most technically proven and airtight medium for large-scale seasonal storage (with minimal gas leakage under proper pressure cycling), they exist only in specific geographic regions with suitable subsurface salt geology. Alternative formations, such as depleted oil and gas fields or deep saline aquifers, require extensive geological characterization and continuous monitoring to prevent caprock fracturing, microbial consumption of hydrogen, and subsurface gas migration.
2. Cryogenic Liquid Hydrogen (LH2)
By cooling gaseous hydrogen below its boiling point of −253°C (20 Kelvin) at atmospheric pressure, hydrogen condenses into a liquid, increasing its volumetric density to 71 kg/m3:
- Energy Penalty: Liquefying hydrogen is technically demanding, requiring advanced multi-stage cryogenic refrigeration cycles that consume 25% to 35% of the energy contained in the hydrogen itself, as documented by the U.S. Department of Energy (DOE) Hydrogen Storage Office.
- Boil-Off Losses: Despite vacuum-insulated multi-layer cryogenic tanks, ambient heat ingress causes boil-off (with an indicative range of 0.1% to 0.5% of liquid volume per day, depending on storage vessel geometry, insulation design, surface-to-volume ratio, and operating ambient conditions), requiring pressure relief venting or active boil-off gas reliquefaction systems.
3. Chemical Hydrogen Carriers: Ammonia and LOHCs
To avoid extreme cryogenic temperatures or ultra-high pressures, hydrogen can be chemically synthesized into denser carrier liquids:
- Green Ammonia (NH3): Hydrogen is combined with atmospheric nitrogen via the Haber-Bosch process to form ammonia. Liquid ammonia stores 50% more hydrogen by volume than cryogenic liquid hydrogen, condenses at a manageable −33°C, and leverages existing global maritime shipping ports and refrigerated transport infrastructure.
- Liquid Organic Hydrogen Carriers (LOHCs): Aromatic compounds (such as toluene or dibenzyltoluene) that can be repeatedly hydrogenated and dehydrogenated through catalytic reactions, behaving essentially like synthetic crude oil during transport.
4. Pipeline Infrastructure and Grid Blending
Transporting hydrogen through pipeline networks represents the lowest-cost delivery mechanism for bulk industrial volumes:
- Natural Gas Blending (Infrastructure-Specific Limits): Pipeline blending is not a universal plug-and-play solution across all natural gas grids. While certain low-pressure regional distribution pipelines have demonstrated technical tolerance for 2% to 10% (and experimentally up to 20%) hydrogen blending by volume in pilot trials, blending thresholds depend on pipeline metallurgy, pipe age, compressor station configurations, elastomer seals, and the safety tolerance of downstream household and industrial appliances. Higher hydrogen concentrations require detailed assessment of pipeline materials, welds, compressors, seals, metering equipment, and downstream appliances. Depending on the infrastructure, modifications, component replacement, or dedicated hydrogen pipelines may be necessary.
- Dedicated Pure Hydrogen Pipelines: Transporting 100% pure H2 requires rigorous material and engineering qualification. Pipeline material selection depends on operating pressure, pipeline design, hydrogen compatibility, and applicable safety standards, rather than a single universal material choice. High-strength and other susceptible steels can be affected by hydrogen embrittlement. Hydrogen entering the metal can reduce its ductility and fracture resistance under certain material, stress, and operating conditions. The severity depends on steel composition, hydrogen exposure, pressure, temperature, and mechanical loading.
Hydrogen Safety Considerations
Public discourse often raises safety concerns regarding hydrogen flammability. Like all concentrated fuels, hydrogen requires rigorous, standardized engineering controls:
- Wide Flammability Range: Hydrogen ignites in air across a very wide concentration window of 4.0% to 75.0% by volume (compared to 1.4%–7.6% for gasoline vapor), with a detonation range of 18.3% to 59.0%.
- Extremely Low Ignition Energy: Requires just 0.02 millijoules to ignite—a fraction of the spark energy needed for natural gas. Even an invisible electrostatic discharge from human clothing can trigger ignition.
- Flame Characteristics and Leak Detection: In daylight, a hydrogen flame is almost invisible pale-blue, emitting very low radiant infrared heat. Appropriate hydrogen leak and flame detection systems—selected through a facility-specific hazard assessment and compliant with relevant safety codes (such as NFPA 2 or regional standards)—are employed to continuously monitor storage manifolds, compression rooms, and distribution equipment.
- Buoyancy and Ceiling Ventilation: Hydrogen is roughly 14 times lighter than air and rises rapidly in unconfined outdoor spaces. However, in enclosed or semi-enclosed structures, escaping hydrogen rapidly accumulates at ceiling pockets, creating severe localized explosion hazards. Hydrogen leakage must never be described as harmless; facilities require hazardous-area-rated electrical equipment compliant with applicable regional safety standards (such as ATEX in the European Union or Class I, Division 1/2 NEC codes in North America), passive ceiling venting, and positive mechanical exhaust systems.
- Combustion vs. Fuel Cell Emissions (The NOx Factor): Pure hydrogen combustion releases zero carbon dioxide, carbon monoxide, sulfur dioxide, or particulate soot from the fuel itself. However, when hydrogen is combusted in ambient air at high flame temperatures (which can exceed 2,000°C), atmospheric nitrogen and oxygen react via the thermal Zeldovich mechanism to generate Nitrogen Oxides (NOx), which are regulated air pollutants. Managing NOx in hydrogen burners requires lean-premixed combustion, water injection, or selective catalytic reduction (SCR). In contrast, electrochemical fuel cells operate without combustion and do not produce combustion-related NOx. Their reaction produces water and heat; depending on operating conditions, the water may leave the system as liquid or vapour.
5. Major Applications of Green Hydrogen
Green hydrogen is not an all-purpose replacement for every fossil-fuel appliance. Direct electrification with batteries and heat pumps is far more energy-efficient for residential heating and passenger cars.
Instead, green hydrogen's true value lies in decarbonizing "hard-to-abate" industrial sectors—heavy manufacturing, high-heat processes, and long-range transport where battery electrification is physically or economically impractical.
1. Low-Emission Steelmaking: Green Hydrogen and Green Steel
Traditional primary steel production relies on blast furnaces fed with metallurgical coking coal. The carbon in coal acts as a chemical reducing agent, stripping oxygen atoms from iron ore (Fe2O3) to produce metallic iron—a process responsible for roughly 7% to 9% of all global greenhouse gas emissions.
Green hydrogen transforms steelmaking via Direct Reduced Iron (DRI):
- Green hydrogen is fed into a shaft furnace to react with iron ore:
- The reducing reaction releases harmless water vapor rather than carbon dioxide. The resulting sponge iron is subsequently melted in an Electric Arc Furnace (EAF) powered by renewable electricity. While pilot and industrial demonstration projects (such as Sweden's HYBRIT initiative) indicate technical potential to reduce primary steelmaking emissions by up to ~95%, real-world sector-wide emissions reductions are not an automatic guarantee: they depend strictly on project-specific configurations, including the availability of 100% renewable electricity for both the electrolyzers and the electric arc furnaces, as well as the global supply of premium DR-grade iron ore pellets.
2. Green Fertilizer and Chemical Synthesis
Modern agriculture depends on nitrogen fertilizers manufactured via the Haber-Bosch process, which synthesizes ammonia from nitrogen and hydrogen:
Today, fossil natural gas provides the hydrogen for fertilizer production. Replacing fossil-derived hydrogen with green hydrogen can substantially reduce emissions associated with ammonia and fertilizer manufacturing. However, emissions from fertilizer application, including nitrous oxide (N2O) released from agricultural soils, remain a separate environmental challenge.
3. Heavy-Duty Long-Haul Freight and Transit
While passenger cars are overwhelmingly moving toward battery electric drivetrains, heavy-duty commercial freight operations face payload and route trade-offs:
- In specific commercial vehicle-study estimates for long-haul semi-trucks, an 800+ kilometer route modeled with battery power has been estimated to require an 800 to 1,000 kWh battery pack weighing approximately 4,000 to 6,000 kg, which would reduce allowable freight cargo capacity (though actual figures vary across battery cell chemistry, chassis integration, and emerging high-power megawatt charging standards).
- By contrast, technical evaluations published by the National Laboratory of the Rockies (NLR, formerly NREL) indicate that in some long-haul commercial vehicle configurations, a hydrogen fuel cell truck carrying 40 to 60 kg of compressed hydrogen can store equivalent usable energy in lightweight carbon-composite tanks and achieve refueling in approximately 10 to 15 minutes at high-flow commercial dispensers, matching conventional diesel duty cycles.
4. Deep-Sea Maritime Shipping and Sustainable Aviation Fuels
Long-haul transoceanic cargo ships and commercial aviation cannot accommodate the weight and volume of lithium-ion battery banks. Green hydrogen serves as the essential feedstock to synthesize zero-carbon marine and aviation fuels:
- Green Methanol (CH3OH): Produced by combining green hydrogen with sustainably sourced biogenic or directly captured CO2. Methanol-capable ships can use this fuel, but the actual lifecycle emissions benefit depends on the origin of the methanol and the carbon feedstock.
- E-Kerosene (Sustainable Aviation Fuel - SAF): Synthetic hydrocarbon jet fuel created via Fischer-Tropsch synthesis from green hydrogen and captured carbon. Under ASTM D7566, certain approved synthetic aviation-fuel pathways can be blended with conventional aviation turbine fuel at specified limits, which may be up to 50% depending on the pathway and applicable annex. The permitted blend limit should not be treated as universal for every synthetic fuel.
5. Multi-Day and Seasonal Grid Balancing
Unlike batteries that economically discharge over 2 to 8 hours, green hydrogen stored in geological salt caverns can be piped to combined-cycle gas turbines or megawatt fuel cell installations to generate clean electricity during prolonged winter weather anomalies or multi-week wind droughts (the European phenomenon known as Dunkelflaute).
6. How Does Hydrogen Fuel Cell Technology Work?
A fuel cell is an electrochemical conversion device that converts the chemical energy of hydrogen directly into electricity, water, and heat—without combustion.
The Fuel Cell Chemical Reaction
The most widely adopted fuel cell technology for transport and distributed power is the Proton Exchange Membrane Fuel Cell (PEMFC). It is essentially an electrolyzer running in reverse:
- At the Anode: Hydrogen gas flows into the fuel cell and encounters a platinum catalyst layer. The catalyst splits each hydrogen molecule into two protons (H+) and two electrons (e−).
- Through the Membrane: The polymer electrolyte membrane allows only the positively charged protons to pass through to the cathode.
- The External Circuit: The freed electrons cannot cross the membrane. They are forced through an external electrical circuit, generating a direct-current (DC) electric motor load that powers the vehicle or electrical grid.
- At the Cathode: On the other side, oxygen from ambient air combines with protons and returning electrons on a second catalyst layer to produce water and heat. Unlike hydrogen combustion, the electrochemical fuel-cell reaction does not produce direct CO₂ emissions or combustion-related NOx. Depending on operating conditions, water may leave the system as liquid or vapour.
Battery EV vs. Hydrogen Fuel Cell Vehicle: A Rigorous Comparison
A frequent point of confusion among clean energy consumers is the competition between Battery Electric Vehicles (BEVs) and Fuel Cell Electric Vehicles (FCEVs). As benchmarked by the U.S. DOE Fuel Cell Technologies Office and the IEA, both are zero-emission electric vehicles driven by electric traction motors, but their energy storage mechanisms and practical efficiencies differ substantially:
| Performance Parameter | Battery Electric Vehicle (BEV) | Fuel Cell Electric Vehicle (FCEV) |
|---|---|---|
| Primary Energy Storage | Electrochemical Lithium-ion or LFP battery pack | High-pressure (700 bar) compressed hydrogen tank + small buffer battery |
| "Well-to-Wheel" Energy Efficiency | 70% to 85% (High round-trip efficiency: grid → charger → battery → inverter → motor) |
Illustrative 30% to 40% (Pathway-dependent: grid → electrolysis → compression/delivery → fuel cell → motor; exact efficiency depends on system boundary and operating pressure) |
| Refueling / Recharging Duration | 20 to 60 minutes (DC fast charging); 4 to 8 hours (AC home charging) | 3 to 5 minutes (dispensing compressed gas at commercial 700 bar pumps) |
| Driving Range per Full Tank/Charge | 350 to 600 km (typical passenger models) | 600 to 800+ km (unaffected by cold ambient cabin heating demands) |
| System Weight vs. Range Scaling | Weight scales linearly with battery capacity; doubling range adds hundreds of kilograms of heavy battery cells. | Weight scales moderately; increasing range requires larger, lightweight carbon-fiber composite tanks with minimal weight penalty. |
| Infrastructure Availability | Widespread, rapidly growing global network of residential, workplace, and public DC fast chargers. | Extremely sparse; high capital expenditure required for specialized high-pressure hydrogen refuelling stations (typically $1.5M to over $3M+ per station depending on daily dispensing capacity, compressor redundancy, and on-site storage architecture). |
| Optimal Sector Application | Dominant in: Passenger cars, urban delivery vans, city buses, and short-haul commercial transport due to superior well-to-wheel efficiency and lower running costs. | Potentially suitable for: Selected heavy-duty applications (e.g., continuous 24/7 port logistics, transcontinental Class 8 freight, mining haulers) where rapid 5-minute refueling and payload constraints are critical. |
Practical Conclusion: In real-world fleet operations, neither technology offers a universal victory. Hydrogen fuel cells may be suitable for selected heavy-duty, long-haul routes where payload mass and rapid turnaround times are paramount, while battery-electric vehicles generally offer much higher energy efficiency, lower operating costs per kilometer, and a vastly more accessible charging infrastructure network.
7. Advantages and Realistic Economic Challenges of Green Hydrogen
To evaluate green hydrogen objectively, one must balance its transformative capabilities against its physical and financial constraints:
Key Advantages
- Potential for Very Low Lifecycle Emissions: Operates with near-zero greenhouse gas emissions at the point of production when powered by dedicated solar, wind, or hydro assets, offering a substantial emissions reduction compared to fossil reforming.
- Decarbonizes "Hard-to-Abate" Sectors: Provides the chemical reducing power and molecular feedstock required for steel, fertilizer, and chemical synthesis where direct battery electrification is technically impractical.
- High Gravimetric Energy Density: Delivers unmatched energy per kilogram for heavy vehicle payloads and aerospace.
- Resilience and Energy Sovereignty: Enables nations with abundant solar and wind resources (such as India, Australia, and Middle Eastern countries) to manufacture their own domestic energy carriers, reducing dependence on imported oil and liquefied natural gas (LNG).
Critical Challenges and Limitations
The primary thermodynamic limitation of green hydrogen for power-to-power storage is its compound round-trip conversion loss. In an illustrative pathway starting with 100 kWh of renewable electricity:
- Electrolysis: Converts electricity to hydrogen at ~65% to 75% efficiency, yielding approximately 65 to 75 kWh of chemical hydrogen energy (LHV).
- Compression, Storage & Delivery: Mechanical gas compression, cooling, and transport impose additional energy losses (typically consuming 10% to 15% of the contained fuel energy).
- Fuel-Cell Conversion: Converting hydrogen back into electricity inside an automotive or stationary fuel cell operates at roughly 50% to 60% electrical efficiency.
- Final Electricity Delivered: In this illustrative pathway, roughly 30 to 38 kWh of usable electricity is ultimately delivered to the motor or grid load.
Note: This 30% to 38% power-to-power figure is presented as an illustrative example of system losses, not a universal benchmark. Actual round-trip efficiency depends heavily on delivery distance, compression pressure (e.g., 350 vs. 700 bar), and balance-of-plant auxiliary loads. By contrast, direct battery storage delivers 75% to 85% round-trip efficiency, which is why direct electrification is preferred wherever practically viable.
- High Production Cost: In most markets, green hydrogen currently exhibits an indicative regional production cost of roughly $3.50 to $6.50 per kilogram (varying substantially with local renewable power purchase agreements, electrolyzer capex, and plant utilization hours), compared to roughly $1.00 to $2.00/kg for unabated fossil grey hydrogen. Achieving commercial parity will require lower electrolyzer capital costs, higher manufacturing scale, improved plant utilisation, and access to competitively priced renewable electricity. Under favourable deployment and manufacturing conditions, installed electrolyzer costs could fall by around 50% by 2030, although actual reductions will depend on market growth and project execution.
- Water Requirements Across Feedstock and Cooling: Standard water electrolysis requires high-purity demineralized water (~9 to 11 liters per kg of H2 theoretically for chemical splitting). Actual facility water consumption depends on electrolyzer technology, cooling system design, climate, and water-treatment configuration. A recent technical review reported average water consumption of approximately 17.5 liters per kg of hydrogen for PEM electrolysis and 22.3 liters per kg for alkaline electrolysis. Because water withdrawal and water consumption represent different engineering metrics, project-specific figures should be assessed separately. In water-stressed arid regions where solar resources are strongest, projects increasingly co-locate seawater desalination facilities to supply feedwater without depleting municipal or agricultural aquifers.
- Nascent Distribution and Transport Infrastructure: There is no extensive global pipeline network for pure hydrogen. Transporting hydrogen over long distances via tube trailers or cryogenic tankers remains expensive, often doubling or tripling the delivered cost at the pump.
8. Green Hydrogen Development Around the World
Governments and international energy conglomerates are committing hundreds of billions of dollars to transition green hydrogen from demonstration pilot projects to gigawatt-scale industrial infrastructure.
India's National Green Hydrogen Mission
In January 2023, the Government of India formally launched the National Green Hydrogen Mission, approved by the Union Cabinet and administered by the Ministry of New and Renewable Energy (MNRE), with an initial mission outlay of ₹19,744 crore (~$2.4 billion USD). The mission defines ambitious future targets for the year 2030 to position India as a global manufacturing and export hub for clean hydrogen:
| Strategic Mission Dimension | Official 2030 Future Target |
|---|---|
| Annual Green Hydrogen Production Capacity | At least 5 MMT (Million Metric Tonnes) per annum |
| Dedicated Renewable Energy Capacity Addition | Approximately 125 GW across solar, wind, and hybrid plants |
| Total Anticipated Inflow of Capital Investment | Over ₹8 lakh crore (~$100+ billion USD) |
| Clean Energy Employment Generation | Creation of over 6 lakh (600,000+) jobs |
| Cumulative Greenhouse Gas Emission Abatement | Nearly 50 MMT of annual CO2 emissions abated |
| Displacement of Fossil Fuel Imports | Over ₹1 lakh crore (~$12+ billion USD) savings |
Source: Government of India, Press Information Bureau (PIB), 4 January 2023 — Union Cabinet Approves National Green Hydrogen Mission (PRID 1888547).
A core pillar of the mission is the Strategic Interventions for Green Hydrogen Transition (SIGHT) Programme (allocating ₹17,490 crore), which provides targeted financial incentives for domestic electrolyzer manufacturing gigafactories and direct production subsidies per kilogram of green hydrogen produced, anchored around coastal export hubs at major ports such as Kandla, Paradip, and Tuticorin.
Global Green Hydrogen Initiatives
- United States: The federal strategy combines research cost targets with statutory infrastructure funding. The Department of Energy's Hydrogen Energy Earthshot ("Hydrogen Shot") defines an ambitious technology target of "$1 for 1 kilogram in 1 decade" ("1 1 1"). Operating alongside this research initiative, the Infrastructure Investment and Jobs Act (IIJA) legislated $8 billion in federal funding to establish regional Clean Hydrogen Hubs (H2Hubs) across the nation, complemented by clean hydrogen production tax credits under Section 45V of the Inflation Reduction Act.
- European Union (REPowerEU Strategy): Establishes a 2030 ambition and target of 10 million tonnes of domestic renewable hydrogen production and 10 million tonnes of imports, supported by financing through the European Hydrogen Bank and sector-specific renewable fuel quotas for maritime and industrial consumers.
- China: Leading global deployment of utility-scale alkaline electrolyzers, commissioning mega-projects such as the Sinopec Kuqa facility in Xinjiang (producing 20,000 tonnes of green hydrogen annually powered by a 260 MW solar farm).
- Australia and the Middle East (Saudi Arabia / UAE): Developing multi-gigawatt export-oriented green ammonia plants (such as the NEOM Green Hydrogen Project in Saudi Arabia, powered by 4 GW of co-located solar and wind).
9. The Future Outlook of Green Hydrogen Energy
Over the coming decades, green hydrogen could evolve from a specialized industrial chemical into an important pillar of global deep decarbonization. Long-term commercial cost targets—such as producing clean hydrogen at $1.50 to $2.00 per kilogram—depend on scalable industrial progress, policy support, and supply chain expansion across three primary economic drivers:
1. Electrolyzer Capital Cost Deflation (Capex Scaling)
Just as solar photovoltaic module manufacturing costs fell by more than 85% between 2010 and 2025 through automated mass production, the electrolyzer sector is currently transitioning from bespoke assembly to standardized manufacturing. According to technical analysis by the International Energy Agency (IEA), installed electrolyzer capital costs could fall by around 50% by 2030 under favourable deployment, supply chain scale-up, and manufacturing conditions, though slower project commissioning and high material costs could constrain cost reductions.
2. Declining Renewable Electricity Costs (LCOE Compression)
Because electrical power represents 60% to 75% of the total levelized cost of green hydrogen, access to ultra-cheap renewable power is the single most important financial factor. In world-class solar and wind resource corridors (such as Western India, Australia, Chile, and the Middle East), long-term power purchase agreements (PPAs) are already closing at $0.02 to $0.025 per kilowatt-hour. As utility-scale solar and offshore wind capacity continue to scale globally, these declining generation costs directly compress hydrogen production expenses.
3. Industrial Cluster Integration ("Hydrogen Valleys")
Rather than building thousands of kilometers of capital-intensive long-distance hydrogen pipelines during initial commercialization, early adoption is clustering around "Hydrogen Valleys". These are regional industrial ecosystems where renewable power, water supplies, electrolyzer plants, and heavy consumers (steel manufacturing plants, chemical refineries, fertilizer producers, and deep-sea shipping ports) are co-located in close physical proximity. Co-location eliminates distribution bottlenecks and transport markups, creating immediate commercial viability while nationwide pipeline networks mature.
10. Frequently Asked Questions (FAQs)
1. Is green hydrogen really environmentally friendly?
Yes, when produced exclusively using verified renewable electricity (such as solar, wind, or hydroelectric power), water electrolysis generates zero direct greenhouse gases or airborne pollutants during operation. However, assessing its full lifecycle footprint requires accounting for the embodied carbon in manufacturing electrolyzers and solar panels, electricity grid connection mixes, compression energy, and preventing atmospheric hydrogen leakage. Peer-reviewed evaluations (such as a 2024 synthesis in Nature Energy) find a median cradle-to-gate lifecycle carbon intensity of roughly 2.9 kg CO2e per kg of H2 under dedicated renewables—dramatically cleaner than fossil grey hydrogen (~10–12 kg CO2/kg), though not completely zero.
2. Can green hydrogen be used in residential homes?
For typical residential heating and cooking, green hydrogen is generally neither practical nor economically efficient compared to direct electrification. Modern electric heat pumps and induction cooktops consume three to five times less renewable electricity than manufacturing, transporting, and burning green hydrogen in a boiler. While pilot projects test blending up to 5% to 20% hydrogen into municipal gas grids, pure hydrogen heating would require replacing distribution pipelines, residential meters, and home appliances.
3. Is green hydrogen better than solar or battery energy?
Green hydrogen does not compete with solar energy; it directly relies on it. Green hydrogen is manufactured by utilizing solar and wind electricity. Compared to battery storage, direct battery charging is far more energy-efficient (75% to 85% round-trip efficiency versus ~30% to 40% for hydrogen power-to-power). However, green hydrogen excels where batteries face physical limits: multi-week seasonal grid storage, high-heat manufacturing, chemical feedstocks for fertilizer and steel, and transoceanic shipping.
4. How much water is required to produce 1 kg of green hydrogen?
The theoretical chemical feedstock requirement is approximately 9 liters of high-purity demineralized water per 1 kilogram of hydrogen gas. Actual total facility water consumption depends on electrolyzer technology, cooling system design, climate, and water treatment, with recent technical evaluations reporting average consumption of roughly 17.5 liters per kg of hydrogen for PEM electrolysis and 22.3 liters per kg for alkaline systems. Water withdrawal and water consumption are distinct metrics and vary across specific project designs. In arid coastal regions, integrating seawater desalination allows facilities to operate sustainably without competing with municipal or agricultural freshwater supplies.
5. What is the difference between green hydrogen and blue hydrogen?
The fundamental difference lies in the feedstock, production method, and lifecycle emissions. Green hydrogen is synthesized by splitting water using 100% renewable electricity, emitting zero direct operational CO2. Blue hydrogen is produced from fossil natural gas using steam methane reforming (SMR) or autothermal reforming (ATR), paired with carbon capture and storage (CCS) units that typically capture 60% to 90%+ of emissions depending on process design. While blue hydrogen is currently cheaper to produce, it remains tied to fossil extraction and risks upstream fugitive methane leakage.
Official Industry Standards & Technical References
- Ministry of New and Renewable Energy (MNRE), Government of India: National Green Hydrogen Mission Portal — Official policy guidelines, SIGHT incentive structures, and 2030 strategic benchmarks for India's clean hydrogen transition.
- Press Information Bureau (PIB), Government of India: Union Cabinet Approves National Green Hydrogen Mission (4 Jan 2023) — Official Cabinet approval release detailing targets of 5 MMT production, 125 GW renewable addition, and ₹8 lakh crore investment.
- International Energy Agency (IEA): Hydrogen Energy Research & Global Hydrogen Review — Global technical review analyzing electrolyzer deployment, project pipelines, levelized cost trajectories, and emission accounting standards.
- U.S. Department of Energy (DOE): Hydrogen and Fuel Cell Technologies Office (HFTO) — Federal technical standards covering water electrolysis pathways, Hydrogen Shot benchmarks, and fuel cell durability testing.
- National Laboratory of the Rockies (NLR, formerly NREL): Hydrogen and Fuel Cells Research Hub — Technical and techno-economic research on electrolyzer degradation, hydrogen storage thermodynamics, commercial vehicle modeling, and system integration.
- Nature Energy (2024): Comparative Lifecycle Assessment of Low-Carbon Hydrogen Production — Peer-reviewed synthesis establishing median cradle-to-gate lifecycle carbon intensity of ~2.9 kg CO₂e/kg for green hydrogen configurations.
- UK Department for Energy Security and Net Zero (DESNZ): Atmospheric Implications of Increased Hydrogen Use — Authoritative study on indirect radiative forcing and hydrogen leakage GWP (11 ± 5).
- International Electrotechnical Commission (IEC): iec.ch — Global technical standards IEC 62282 (Fuel Cell Technologies) and IEC 61010 (Safety Requirements for Electrical Equipment for Measurement, Control, and Laboratory Use).
- ASTM International: Standard ASTM D7566 — Standard Specification for Aviation Turbine Fuel Containing Synthesized Hydrocarbons.
- International Organization for Standardization (ISO): iso.org — Standard ISO 14687:2025 (Hydrogen Fuel Quality — Product Specification for Proton Exchange Membrane Fuel Cell Road Vehicle Applications, Grade D).